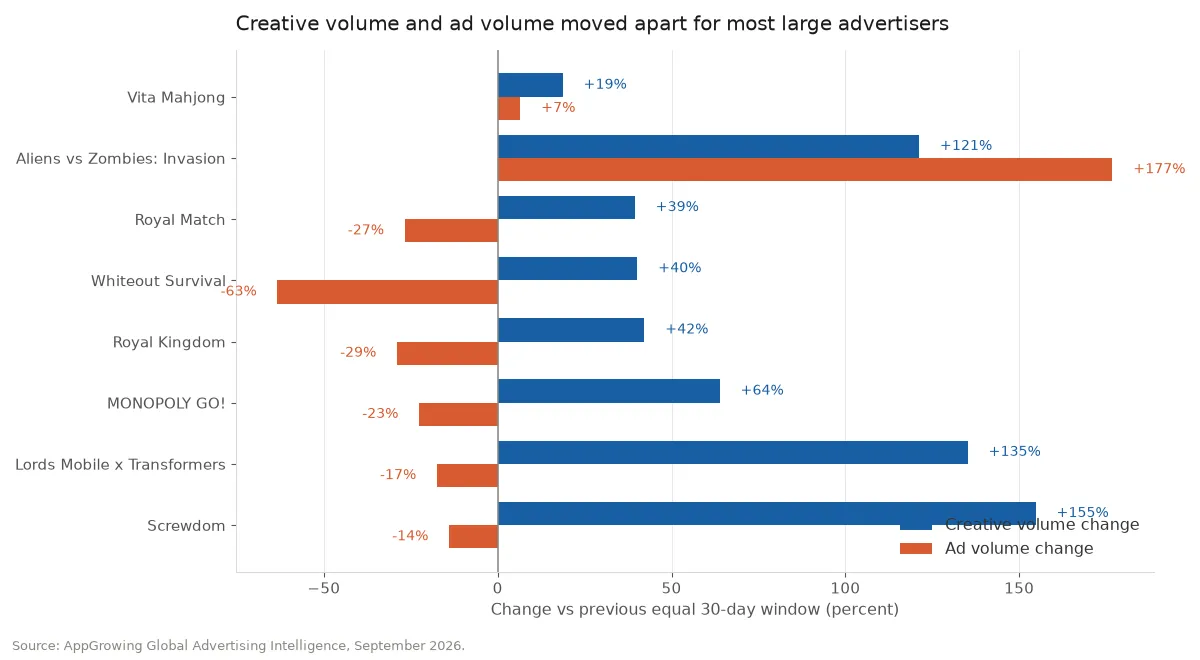
When a game's creative volume rises while its ad volume falls, the useful reading is creative testing intensity, not budget retreat. In the 30 days to 2026-09-29, Whiteout Survival raised video creative records 40.2 percent to 6,293 while cutting ad records 63.4 percent to 38,291; Royal Match did the same shape at 39.4 percent up and 26.7 percent down. Check ad-support per creative before you change anything.
Why do creative volume and ad volume move in opposite directions?
Across the 30 days to 2026-09-29, six of the eight large mobile game advertisers sampled returned the same shape: creative records higher, ad records lower. Screwdom moved from 2,927 to 7,456 creatives (+154.7%) while ads fell from 36,778 to 31,631 (-14.0%). MONOPOLY GO! moved from 5,073 to 8,312 creatives (+63.8%) while ads fell from 54,998 to 42,559 (-22.6%). Royal Kingdom rose 42.2% in creatives and fell 29.0% in ads. The remaining two, Aliens vs Zombies and Vita Mahjong, raised both.
Reading the ad drop as a budget retreat misses what changed. Creative records and ad records count different things. When a team produces more assets but concentrates delivery on a smaller set of proven structures, the two totals separate. The separation is a production signal, not a spending signal.
What does ad-support per creative reveal that the totals hide?
Split the divergence and two different operating models appear. Of the 2,101 Whiteout Survival video assets returned for this window, 720 (about 34 percent) carried a new-asset flag, and the highest linked-ad count in the whole pool sat on a new asset: 107 linked ads over 27 active days. The highest legacy asset carried 159 linked ads over 321 days. That is concentrated release: new assets are selected to carry the main delivery load.
Royal Match ran the opposite way. Of 3,324 video assets returned, 1,872 (about 56 percent) were flagged new, yet roughly 88 percent of the new-asset sample carried only one or two linked ads, with a maximum of 11 over 14 active days. Its highest legacy asset carried 499. That is low-intensity insertion: assets are pushed into the pool, but most carry very light delivery.
Both models lift creative volume and both make ad volume look diluted. They call for different responses. The first is closer to replacing a working asset. The second is closer to widening the test surface.
Which quadrant is your competitor actually in?
Cross creative-volume change with ad-volume change and you get four usable directions. The titles sampled in this window fill them out:
| Quadrant | Shape | Example this window | What to do |
|---|---|---|---|
| Creatives up, ads up | Expansion | Aliens vs Zombies (+121.2% / +176.8%), Vita Mahjong (+18.7% / +6.5%) | Widen monitoring to newly introduced concepts and coverage |
| Creatives up, ads down | Creative expansion with ad concentration | Whiteout Survival (+40.2% / -63.4%), Screwdom (+154.7% / -14.0%) | Review retained assets and per-creative support before following |
| Creatives down, ads down | Synchronised cooling | Tile Explorer (-17.4% / -17.5%) | Audit survivors and separate cooling from structural testing |
| Creatives up, ads flat | Test widening | Meowdoku (+25.7% / +7.8%) | Track whether new concepts get scaled |
These quadrants describe advertising activity inside the queried sample only. They do not establish spend, CTR, CPI, ROI or market size, and they are not a full account of any single product's strategy.
How should a UA team turn this signal into a review task?
When a competitor lands in the creatives-up, ads-down quadrant, do three things. First, pull that entity's creative records and ad records for the same window and confirm both come from one resolved entity, one period and one sort order. Second, read the distribution of linked ads per creative to tell concentrated release from low-intensity insertion. Third, take the assets with the highest linked-ad counts and log their opening hook, gameplay proof and closing CTA as candidate inputs for the next script round.
When one developer's titles sit in different quadrants, track them separately. In this window Century Games' Whiteout Survival fell into creatives-up, ads-down, while Tasty Travels raised ad records 27.3 percent over the same period. A single developer-level reading would blur both.
Re-run the check monthly and re-pull the data every time. Creative records and ad records shift with entity resolution, window length and filters, so carrying last month's absolute values forward produces wrong conclusions.
Not sure whether your category's creative growth is expansion or consolidation?
Get a free benchmark check based on your specific app or game category.
