App growth teams can misread category activity when they monitor ad volume without creative volume. Across these eight mobile app categories, Social has the largest divergence, with ads up 49.2% and creatives down 50.7%, a 99.9 percentage-point gap. Productivity ranks second at 38.8 points, while Books & Reference ranks third at 28.4. The ranking identifies monitoring priority, not campaign performance.
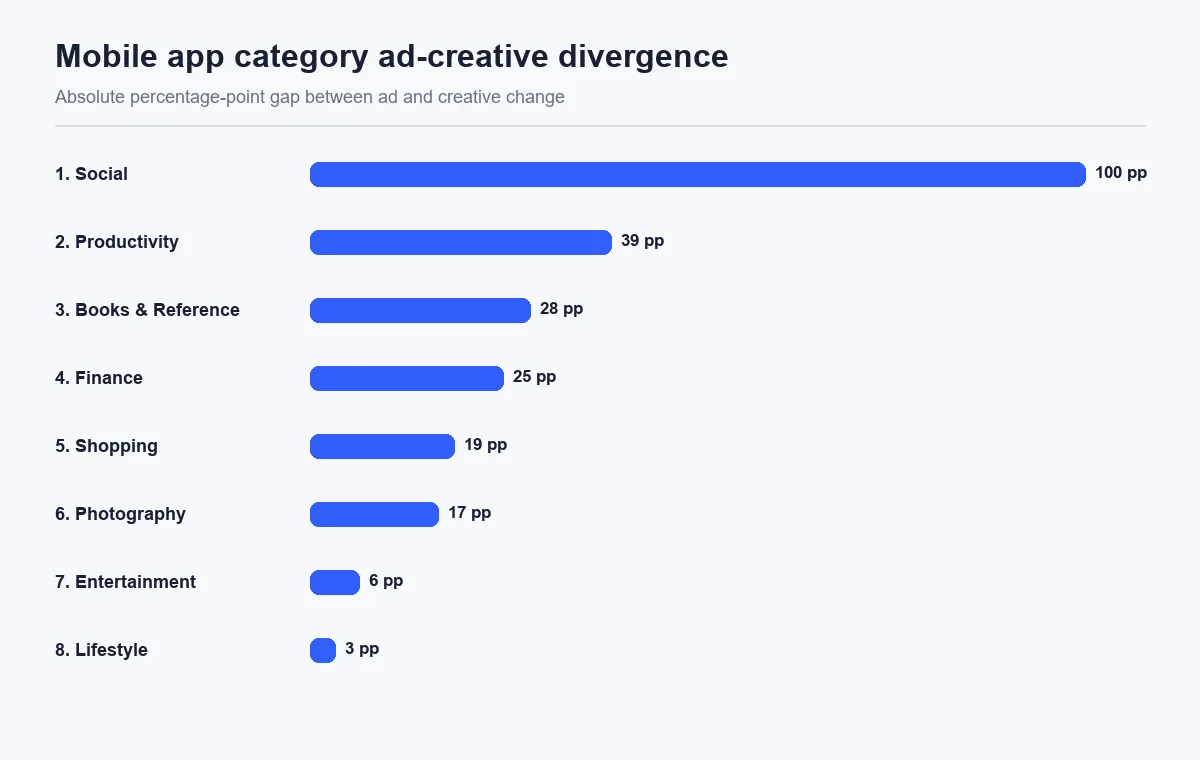
| Rank | Category | Ad change | Creative change | Absolute gap |
|---|---|---|---|---|
| 1 | Social | +49.2% | -50.7% | 99.9 pp |
| 2 | Productivity | -48.9% | -10.1% | 38.8 pp |
| 3 | Books & Reference | -14.0% | +14.4% | 28.4 pp |
| 4 | Finance | -11.1% | -36.0% | 24.9 pp |
| 5 | Shopping | -2.6% | -21.2% | 18.6 pp |
| 6 | Photography | -1.5% | -18.1% | 16.6 pp |
| 7 | Entertainment | +6.2% | +12.6% | 6.4 pp |
| 8 | Lifestyle | -18.5% | -21.8% | 3.3 pp |
Why does Social rank first?
Social ad activity increased from 101,863 to 151,975, while the category creative count fell from 140 to 69. The two measures moved in opposite directions and produced the largest gap in the benchmark. This is a concentration-review signal. Teams should inspect whether a small number of visible concepts support more activity and whether the category result is driven by a narrow group of apps.
The low absolute creative count also calls for careful sampling. One large advertiser or one repeated concept family can influence the visible pattern more strongly than it would in a broader pool. The useful response is to inspect title-level distribution and retained messages. The category fields alone do not show spend, efficiency, or conversion.
Which category signals continued testing during a slowdown?
Books & Reference is the clearest ads-down and creatives-up category. Ads fell from 758,556 to 652,229, or 14.0%, while creatives increased from 1,946 to 2,226, or 14.4%. The category should enter a low-volume test review. Analysts can identify newly visible apps and concepts, then check whether the additional creatives received broad activity or remained limited experiments.
This pattern is different from Social even though both are highly divergent. Social expanded ad activity with a smaller pool. Books & Reference reduced ad activity while the pool widened. The first calls for concentration analysis; the second calls for test-surface analysis.
What does a large same-direction gap mean?
Productivity ads fell 48.9% while creatives declined only 10.1%. Both measures cooled, but ad activity contracted much faster. A review should focus on which creative concepts survived the reduction and whether the remaining pool is spread across many low-activity apps. The 38.8-point gap gives the category high monitoring priority even though the direction is not split.
Finance shows another same-direction gap. Ads fell 11.1%, while creatives fell 36.0%. Here the creative pool contracted faster than activity, so the review should look for retained concepts and possible concentration. Shopping and Photography show milder versions of the same relationship, with creative declines exceeding ad declines by 18.6 and 16.6 percentage points.
Which categories moved most consistently?
Entertainment and Lifestyle sit at the bottom of the divergence ranking, but they represent different states. Entertainment ads rose 6.2% and creatives rose 12.6%, a synchronized expansion signal. Lifestyle ads fell 18.5% and creatives fell 21.8%, a synchronized cooling signal. A low divergence score therefore does not mean a category is stable. It means the two activity measures moved in a more similar direction and magnitude.
For Entertainment, monitor new concepts and coverage expansion. For Lifestyle, identify retained messages and the assets that remain visible after the reduction. The ranking determines how urgently the relationship needs diagnosis; the direction determines the actual work.
How should teams use the four-quadrant rule?
Place every category in one of four groups. Ads up and creatives up indicates expansion. Ads up and creatives down indicates concentration. Ads down and creatives up indicates continued testing without broader activity. Ads down and creatives down indicates cooling. Then rank categories inside each group by the size of the gap.
This workflow keeps the leaderboard actionable. Social becomes the first concentration review, Books & Reference becomes the first continued-testing review, Productivity becomes the first asymmetric cooling review, and Entertainment becomes an expansion watch. The output is a monitoring plan rather than a claim about which category performs best.
Repeat the benchmark with the same categories and an equal period length. Persistent divergence in the same quadrant is a stronger basis for a long-term monitoring segment than one unusually large monthly gap.
