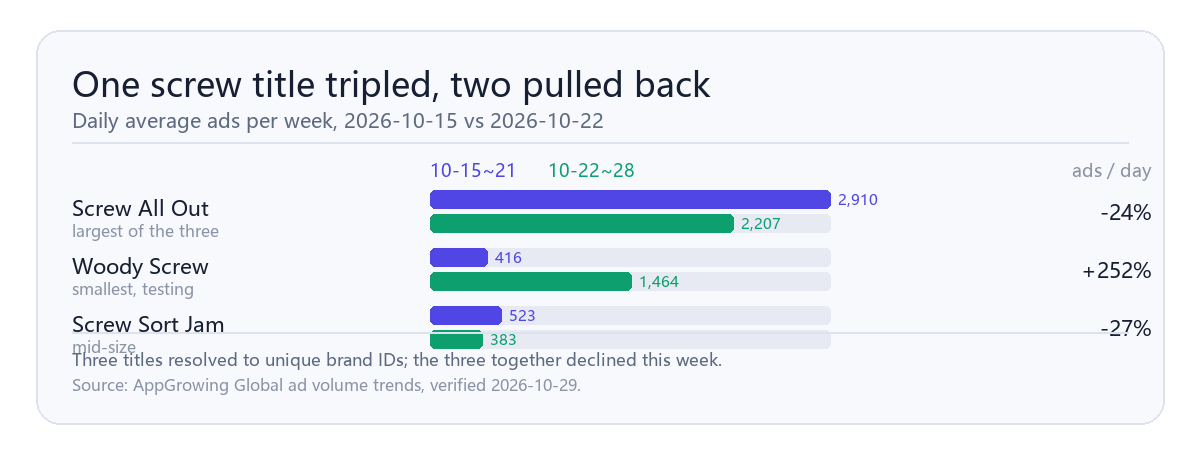
Three screw puzzle games ran side by side in the week of 2026-10-22 to 2026-10-28 and their ad volume went three ways. Woody Screw rose from 416 to 1,464 daily ads, up 252%, with new ads jumping from 65 to 756. Screw All Out, the largest of the three, fell 24% from 2,910 to 2,207. Screw Sort Jam fell 27%, from 523 to 383. Same genre, same week, opposite decisions, and the new-ad ratio explains all three.
Which screw title is actually scaling?
Woody Screw, and the new-ad share is the reason. New ads went from 65 to 756, moving from 15.6% of its daily volume to 51.6%, which means more than half of what it is running this week was built this week. Screw Sort Jam went the other way: new ads fell from 101 to 32, and its new-ad share dropped from 19.3% to 8.4%. One account is filling a pipeline, the other is standing on what it already has.
Read the three together and the genre is not uniformly growing. The three sum to a decline this week, and the growth sits in the smallest account.
Why did the smallest title triple while the largest pulled back?
Base size. At 416 daily ads, Woody Screw needed roughly a thousand more to triple, which in a genre with cheap production and batchable creative is a normal test push rather than a strategic shift. Calling it a new leader overstates it; calling it noise understates it. The accurate label is a test phase.
Screw All Out tells a different story. Total ads fell from 2,910 to 2,207 while new ads barely moved, from 92 to 81, so its new-ad share actually rose from 3.2% to 3.7%. Falling volume with a stable new-ad count is trimming the long tail, not stopping. What it cut was old inventory; what it kept was the running structure.
What does the new-ad ratio tell you that volume does not?
Volume tells you where a competitor stands. The new-ad ratio tells you whether they are rebuilding. An account with a rising ratio is buying its way into new creative; an account with a falling ratio is holding its position and letting old assets age. In a genre where creative life is short, the second pattern usually precedes a volume decline rather than following one, so the ratio is the earlier signal of the two.
How should a team compare three near-identical products?
Three steps. First, place daily ad count and daily new-ad count side by side instead of reading total volume alone. Second, compute the new-ad share: rising means rebuilding, falling means holding. Third, bracket by size, because an account above 5,000 daily ads should be read through its structure while one under 1,000 should be read through its tempo.
Applied here, the week reads as one account testing, one account recycling, one account holding. Two cautions: do not let one title's move stand in for the genre, since the three together declined; and do not treat a new-ad count as a creative count, because one asset can carry many ads.
How often should this trio be re-checked?
Sooner than a monthly report would suggest. Screw puzzle creative is cheap to produce and short-lived, so a test phase can open and close inside two to three weeks, and the new-ad share moves before the total does. A practical rhythm is weekly on the new-ad count and fortnightly on total volume, with a note whenever the new-ad share crosses twenty-five percent in either direction. That threshold is a working rule rather than a measured one, but it keeps attention on the accounts that are changing behaviour instead of the ones that merely sit at the top of the list.
When should this reading be revisited?
When Woody Screw holds above 3,000 daily ads for two consecutive weeks, its test phase is over and the comparison changes shape. Until then relative positions can still flip, especially in a genre with short creative cycles. This is an advertising activity signal, not a campaign performance result.
Want your closest competitors compared this way?
Get a free benchmark check based on your specific app or game category.