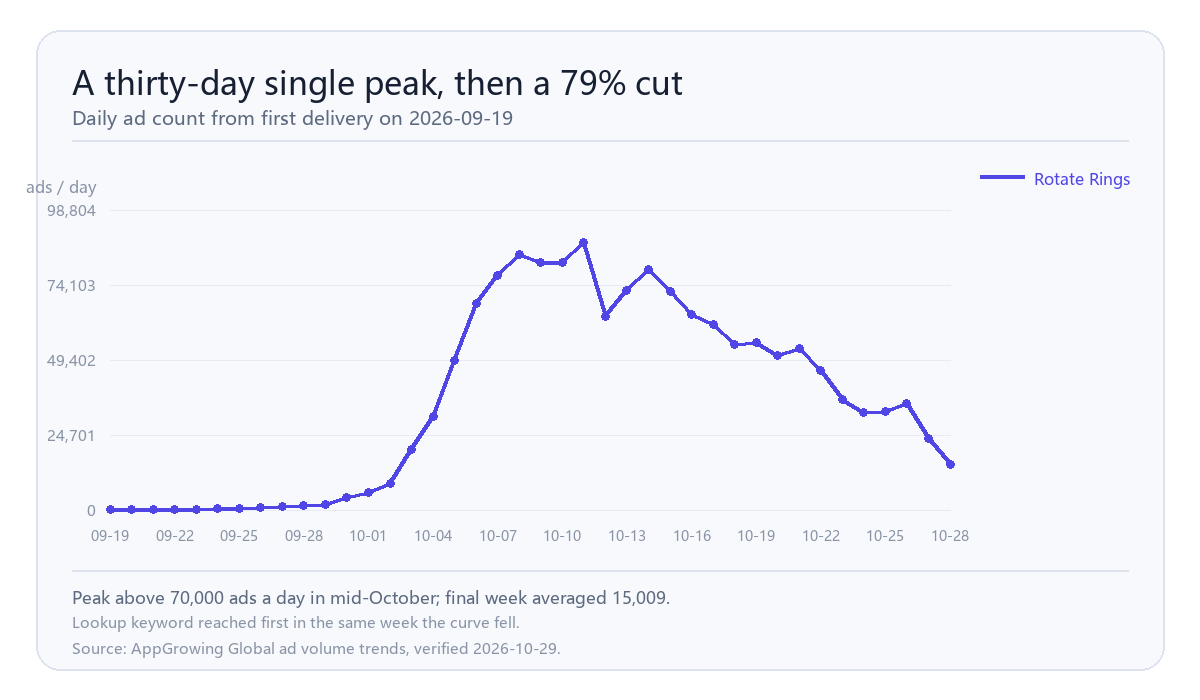
Rotate Rings first appeared with ads on 2026-09-19, climbed past 70,000 ads a day in mid-October, and then fell to 15,009 in the week of 2026-10-22, a 79% single-week drop. In that same week its keyword went from absent to first on the ad-tool lookup list. The top ranking landed on the retreat week, not the expansion week, which makes it a useful case for reading a launch curve rather than a comeback.
Is topping the lookup list the same as scaling?
No. The lookup list records what peers are checking, not what advertisers are buying. This product held 71,817 ads a day in the 15 to 21 October week and fell to 15,009 in the following week. Peers started concentrating on it during the retreat, which usually means they are working out whether the run is over rather than joining it.
What does a first-month launch curve look like?
First delivery on 19 September, under 200 ads a day for the first three days, two to three thousand a day through late September, the volume push in early October, a peak above 70,000 in mid-October, then a fast decline after 22 October with the final days at 23,608 and 15,009. The shape is a single peak about thirty days wide, not a climbing ramp. That shape is common in de-stress puzzle launches, where a title buys hard into a creative concept, reads the result, and either rebuilds or stops.
How do you separate a retreat from creative fatigue?
Watch new ads. At the peak week the account was adding more than thirteen thousand new ads a day; in the final week that fell to 962 and then 474. Total volume down 79% with new ads down more than ninety percent is a decision to stop building, not assets wearing out. Creative fatigue looks different: total volume drifts down while the new-ad count holds, because the team keeps replacing assets that stopped working.
What does the creative itself tell you?
The creatives still running this week are 29-second vertical cuts at 360 by 640, first seen on 27 October, each linked to six to eight ads. Vertical short-form, a single gameplay loop, no voice-over. That is the standard launch configuration for this genre. Nothing in the asset is unusual; what changed is the count.
What should a team do when a signal like this appears?
Three steps. First, separate rank from volume: the ranking only decides whether the product is worth pulling. Second, pull the full curve from first delivery to today and locate the product on the near or far side of its peak. Third, judge whether buying has stopped using absolute new-ad counts rather than percentages, because percentages distort at low bases.
Two cautions. Do not read a first-place lookup as an entry signal. And do not expect a second run until new ads actually turn back up.
Run the same three steps on any unfamiliar name that appears in the list. The first question is always which side of the peak the curve is on, not how high the ranking is.
How should a team use this curve as a launch benchmark?
Keep three numbers from it: days from first delivery to peak, peak daily ads, and days from peak to a seventy percent cut. Here that reads as eighteen days to peak, roughly seventy thousand ads at peak, and six days to the cut. Those three numbers are portable in a way the absolute totals are not, because they describe tempo rather than budget. A team planning its own launch can ask whether it is ahead or behind that tempo, and a team watching a competitor can place any new title on the same three points without knowing its spend.
When would this reading be wrong?
If the product restarts new-ad delivery next week and returns above 30,000 ads a day, the move was a staged launch rather than a wind-down, which happens in this genre: push, pause, rebuild the creative, push again. Watch the new-ad line for that restart. This is an advertising activity signal, not a verdict on the product.
Want a launch curve like this for a competitor?
Get a free benchmark check based on your specific app or game category.