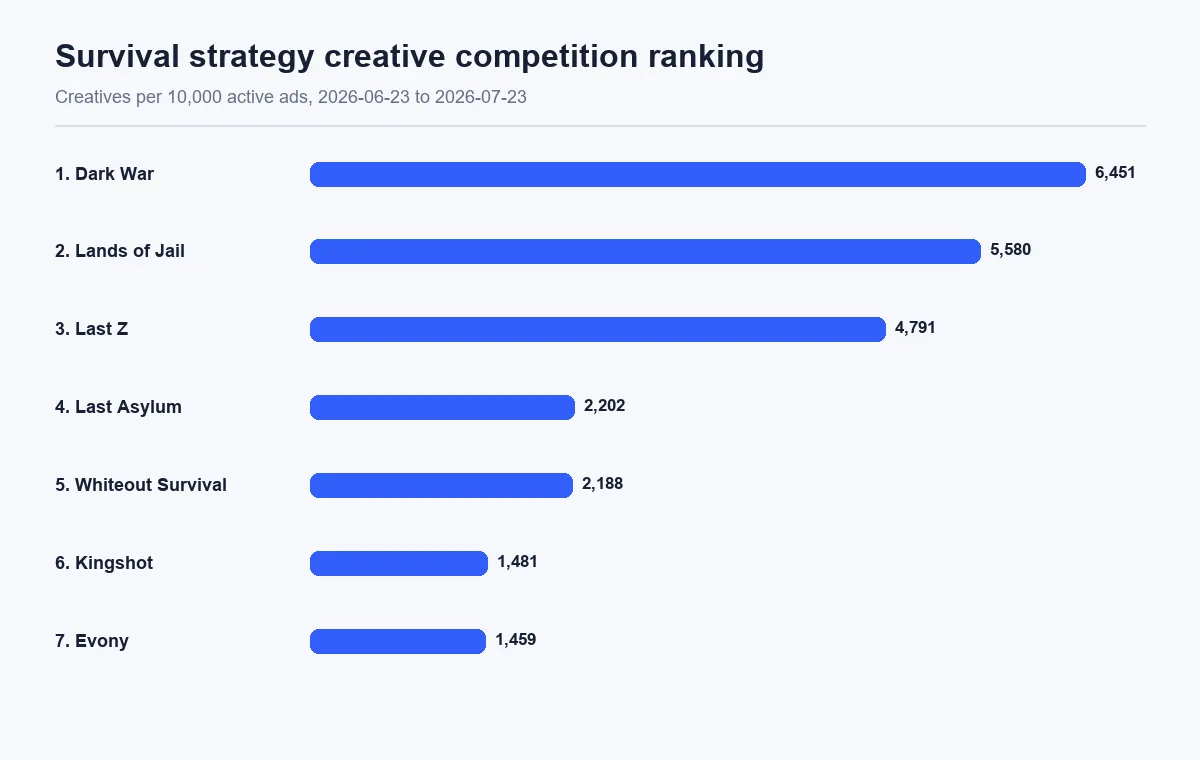
Survival strategy teams often monitor the competitor with the most ads first, but absolute scale misses creative pressure. Across this seven-title watchlist, Dark War ranks first with 6,451 creatives per 10,000 active ads, followed by Lands of Jail at 5,580 and Last Z at 4,791. The ratio identifies titles supported by a relatively broad creative pool. It should guide review priority, not be read as a ranking of CPI, quality, or campaign efficiency.
| Rank | Game | Current ads | Current creatives | Creatives per 10,000 ads |
|---|---|---|---|---|
| 1 | Dark War | 8,656 | 5,584 | 6,451 |
| 2 | Lands of Jail | 7,167 | 3,999 | 5,580 |
| 3 | Last Z | 7,546 | 3,615 | 4,791 |
| 4 | Last Asylum | 10,392 | 2,288 | 2,202 |
| 5 | Whiteout Survival | 23,399 | 5,119 | 2,188 |
| 6 | Kingshot | 39,497 | 5,851 | 1,481 |
| 7 | Evony | 5,196 | 758 | 1,459 |
Which competitor deserves the first review?
If the task is to find a widening test surface, start with Last Z. Its active ads increased from 6,668 to 7,546, or 13.2%, while creatives increased from 2,774 to 3,615, or 30.3%. Both measures expanded and the creative pool grew faster. That combination makes new concepts, opening structures, and narrative combinations the first material group to inspect.
Dark War requires a different review. It has the highest current density, but ads rose 15.7% while creatives increased only 0.4%. A large current pool does not necessarily mean the pool is still expanding quickly. Review retained structures and the distribution of repeated concepts before asking the production team to imitate the newest asset.
Why does high density not mean better performance?
Creative density describes a relationship between two activity fields. It does not report conversion, cost, spend, or revenue. Lands of Jail ranks second on density, yet its ads fell 23.1% and creatives fell 7.7%. The useful interpretation is that a relatively broad pool remained visible while overall activity cooled. A UA team should inspect what survived the decline, not conclude that the title has the strongest campaign.
Evony shows the opposite pattern. It has the lowest density in this set, but ads increased 27.0% and creatives increased 6.0%. That may indicate greater delivery concentration, but the activity data alone cannot prove why. The correct next step is to compare retained and newly introduced concepts, then check whether a small number of messages account for a larger share of visible advertising.
Which divergence signals need closer attention?
Kingshot and Last Asylum deserve a separate divergence review. Kingshot ads fell from 61,558 to 39,497, a 35.8% decline, while creatives edged up 0.5%. Last Asylum ads fell 29.3% while creatives rose 8.8%. In both cases, creative activity moved differently from ad activity. That pattern can occur when testing continues at lower delivery levels, when older creatives remain visible, or when the mix of concepts changes. These are hypotheses to investigate rather than performance conclusions.
Whiteout Survival also shows a concentration signal. Ads increased 2.3%, while creatives declined 18.7%. The title still has 23,399 ads and 5,119 creatives in the current period, so the review should focus on which structures remained after the pool narrowed. A smaller pool supporting slightly more advertising is a stronger retained-creative question than a request for more isolated creative examples.
How should teams turn the ranking into a weekly watchlist?
Use a two-step rule. First, use density to estimate review breadth. High-density titles require sampling across more concept families so that the team does not overlearn from one visible ad. Second, use direction of change to assign the review task. When ads and creatives rise, inspect new concept families. When ads rise and creatives fall, inspect concentration and retained messages. When ads fall and creatives rise, inspect low-volume tests. When both fall, inspect the assets that remain visible.
This approach separates ranking from judgment. Dark War, Lands of Jail, and Last Z lead on density, but they do not represent the same competitive state. The rank tells the team where the creative pool is widest relative to ad activity. The trend tells the team what question to ask when opening the material library.
