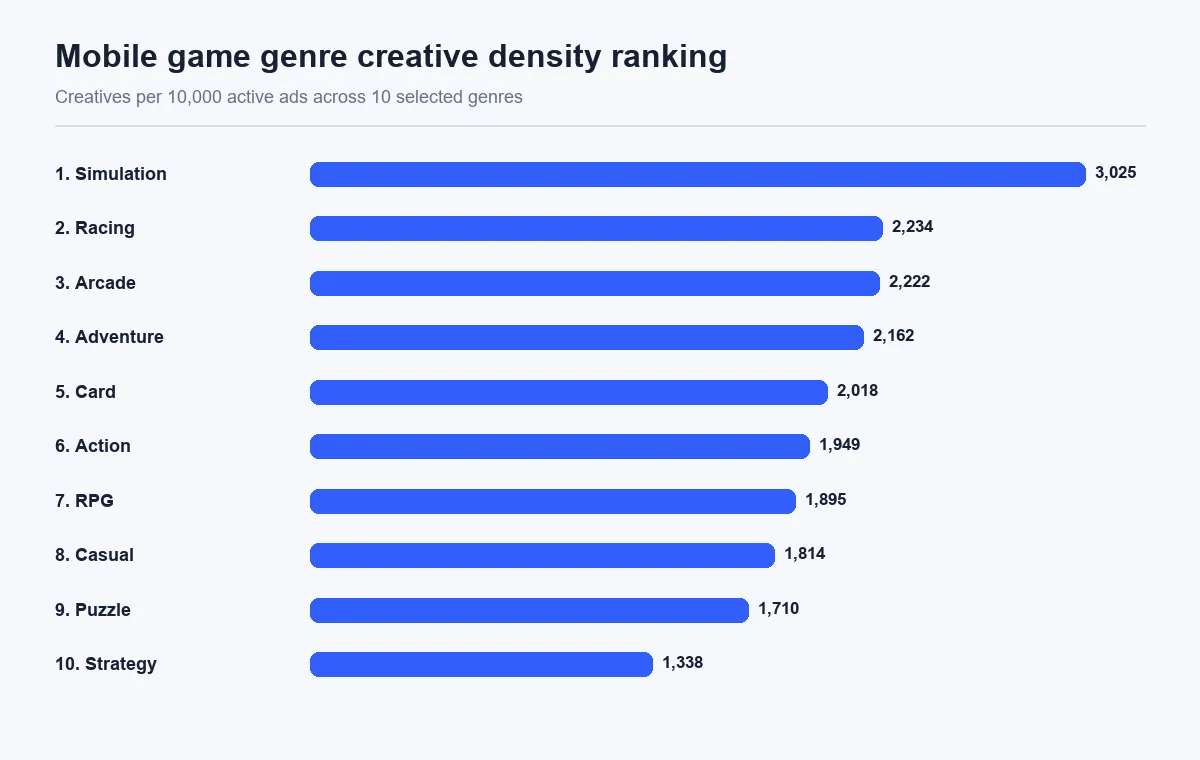
Ranking mobile game genres by active ads gives the largest categories most of the attention, but it does not show how broad their creative pools are relative to activity. Across these 10 selected genres, Simulation has the highest creative density at 3,025 creatives per 10,000 active ads, followed by Racing at 2,234 and Arcade at 2,222. The ratio creates a comparable review benchmark across categories of very different sizes.
| Rank | Genre | Active ads | Creatives | Creatives per 10,000 ads |
|---|---|---|---|---|
| 1 | Simulation | 736,585 | 222,817 | 3,025 |
| 2 | Racing | 423,520 | 94,604 | 2,234 |
| 3 | Arcade | 960,648 | 213,410 | 2,222 |
| 4 | Adventure | 580,578 | 125,541 | 2,162 |
| 5 | Card | 2,800,036 | 565,024 | 2,018 |
| 6 | Action | 1,482,958 | 289,007 | 1,949 |
| 7 | RPG | 2,691,489 | 510,120 | 1,895 |
| 8 | Casual | 1,379,440 | 250,229 | 1,814 |
| 9 | Puzzle | 393,752 | 67,327 | 1,710 |
| 10 | Strategy | 273,936 | 36,639 | 1,338 |
Why does Simulation rank first?
Simulation recorded 736,585 active ads and 222,817 creatives in the current period. Its density is about 36% higher than Racing, the second-ranked category. However, Simulation ads fell 7.2% and creatives fell 8.1% from the previous equal period. The current result therefore describes a broad visible pool, not accelerating expansion.
A Simulation review should sample across distinct gameplay promises, management situations, progression loops, and narrative frames. Looking only at the largest visible ad can underrepresent the category because a high-density segment requires broader sampling. Density is useful here as a workload signal. It tells the analyst that more concept families may need to be checked before a category conclusion is stable.
Which genres show the most important divergence?
Card is the clearest directional outlier. Ads fell from 3,744,943 to 2,800,036, a decline of 25.2%, while creatives increased from 552,232 to 565,024, or 2.3%. That does not prove successful testing. It indicates that the visible creative pool expanded slightly while overall ad activity contracted, making low-volume tests and retained concept families the first review targets.
Adventure shows a related pattern. Ads dropped 29.7%, but creatives declined only 3.1%. Its density of 2,162 still ranks fourth. A team that reads only the ad decline could miss the amount of creative activity that remains visible. The useful action is to compare which concepts persisted through the activity reduction and which appeared only in low-volume placements.
How should teams read the middle of the ranking?
Action, RPG, Casual, and Puzzle sit between 1,710 and 1,949 creatives per 10,000 ads. Their similar density does not mean the categories are strategically identical. RPG has 2.69 million active ads and 510,120 creatives, while Puzzle has 393,752 ads and 67,327 creatives. A comparable ratio can sit on top of very different absolute review workloads.
Use both measures. Density helps compare relative breadth, while absolute volume estimates the number of materials the team may need to process. A high-volume and mid-density category such as RPG may require more total sampling than a smaller category with slightly higher density. The table supports resource planning only when both columns are retained.
What does a low-density genre mean?
Strategy ranks lowest in this selected set at 1,338 creatives per 10,000 ads. The result does not prove that Strategy has fewer advertisers, longer creative life, better delivery, or higher production value. Those explanations require advertiser counts, asset age, delivery distribution, and campaign performance data that are not present in this benchmark.
The safe conclusion is narrower. Strategy currently has more ad activity relative to its visible creative count than the other nine selected genres. A review can test whether activity is concentrated in a smaller number of retained concepts, but concentration should remain a hypothesis until the material distribution is inspected.
How should the ranking guide category research?
Start with density to set sampling breadth, then use month-over-month direction to choose the task. High density with both measures falling calls for retained-concept analysis. Ads down and creatives up calls for low-volume test review. Ads and creatives rising together calls for new-concept mapping. Finally, use absolute volume to decide how much analyst time the category needs.
This four-field method prevents a category leaderboard from becoming a popularity list. Simulation leads the density ranking, Card has the strongest directional divergence, and RPG carries one of the largest absolute pools. Each result answers a different operational question.
