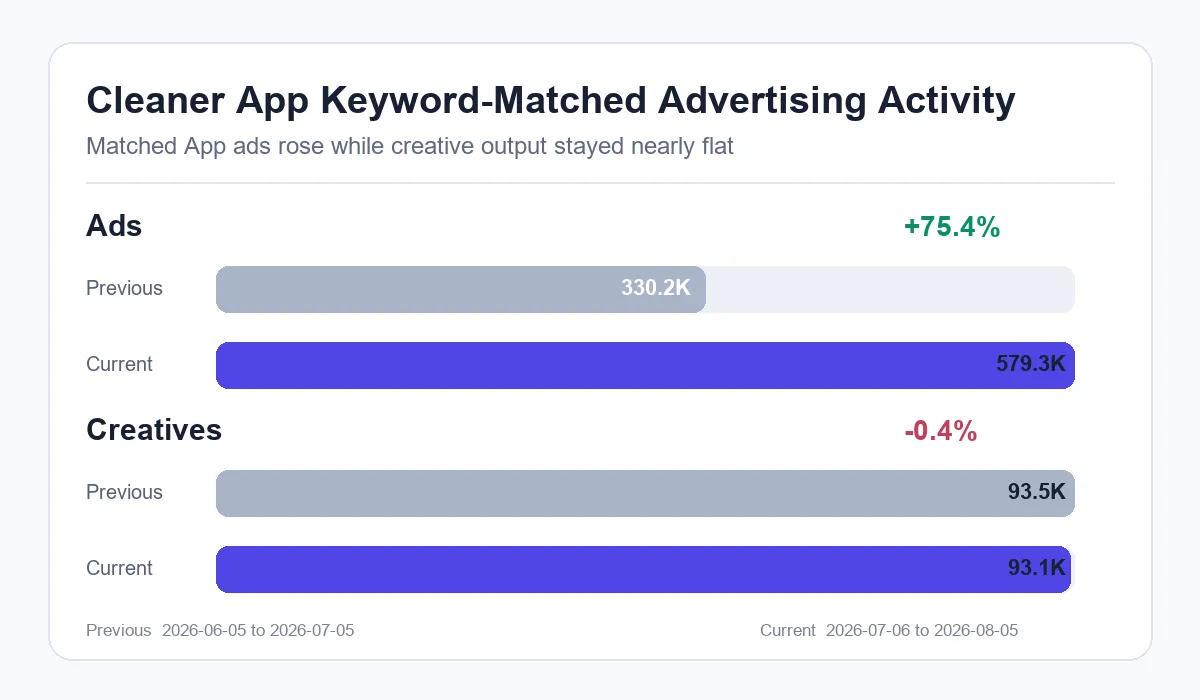
Cleaner-related advertising activity is expanding, but creative supply is not growing with it. In the latest matched data, App ads increased from 330,224 to 579,263, up 75.4 percent, while creatives edged down from 93,534 to 93,123. Because Cleaner is a broad keyword spanning many utility apps, the right response is not to declare that one product is scaling. UA teams should split the keyword into named App entities and then identify which older assets are carrying more delivery.
What does the ad and creative divergence actually show?
The number of creatives per 10,000 ads fell from 2,832.4 to 1,607.6, a 43.2 percent contraction. Advertising activity therefore grew much faster than the supply of distinct matched materials. This is a useful trigger for a distribution-concentration review. Check whether the same image is attached to more ad units, whether one storage-cleaning demonstration is being localized across markets, and whether several publishers are using nearly identical problem-and-solution sequences.
Industry lookup behavior gives the segment a higher monitoring priority. Weekly UV for clean rose from 30 to 33, while cleaner entered the current TOP50 with 11 UV. This is an industry search-interest signal inside AppGrowing. It is not consumer demand or App Store search volume. Its practical value is that it tells a team when a broad topic deserves to be converted into a named competitor list.
Why must teams split Cleaner into named App entities first?
The aggclaw query returned a keyword-matched pool of 84,138 creatives and found more than 1,000 utility apps with Cleaner in the name. The analyzed Top 100 was about 85 percent static images. The video subset also contained screen-recorder products, a laundry-sorting game, workplace messaging, and a technical 3D brand video. Those objects do not share one developer, one product promise, or one creative funnel.
An entity sheet prevents false attribution. Give Cleaner Guru, AI Cleaner, Smart Cleaner, Cleaner Kit, Tidy Cleaner, and other named products separate rows. Record the developer, store identity, opening problem, demonstrated action, result screen, and CTA. Only compare two materials after the App identity is confirmed. This turns a noisy keyword family into a usable watchlist.
Which Cleaner creative structures deserve the first review?
The clearest phone-utility proof chain is simple. The device shows a storage problem, the user starts a cleaning action, and the interface shows freed space or an improved state. Verified video openers also use screenshot-style interfaces, spoken product introductions, and step-by-step feature walkthroughs. Most static images in the sample had no extractable text metadata, so their complete promise and ending could not be verified from the ranking alone.
Long reuse is the stronger signal. Several leading materials had run for more than 1,500 days, one verified example had 2,295 run days, and another static image was linked to 100 ads. These counts describe persistence, not performance. If linked-ad counts keep growing while the distinct creative pool stays flat, inspect localization, placement reuse, and delivery concentration before requesting a larger production batch.
How should the next Cleaner monitoring cycle work?
Start with entity resolution each week. Separate the broad keyword by App name and developer, then capture ads, creatives, creatives per 10,000 ads, and the share of newly observed assets for each entity. In the creative review, compare the opening problem, visible action, outcome state, and CTA only within the same product. This sequence prevents a fragmented market from being reported as one App trend.
Here’s a pattern I keep seeing. Utility categories often look innovative at the keyword level because many publishers use the same broad promise. The useful difference appears only after the reviewer isolates how each product proves the promise. One App may rely on a storage meter, another may show duplicate-photo removal, and another may use a one-tap speed claim. The proof layer, not the word Cleaner, should define the test matrix.
Not sure how to split Cleaner keyword growth into a reliable utility-app watchlist?
Get a free benchmark check based on your specific app or game category.
The decision rule is direct. A broad lookup signal earns the segment a place on the research queue. A large ad increase with flat creative output calls for a concentration review. Confirmed App identity determines what can enter a competitor brief. Following those three steps makes Cleaner useful as a monitoring segment without turning it into a false single-product claim.
