Ranked by Ads Instead of Creatives, the Same 20 Games Reorder Completely
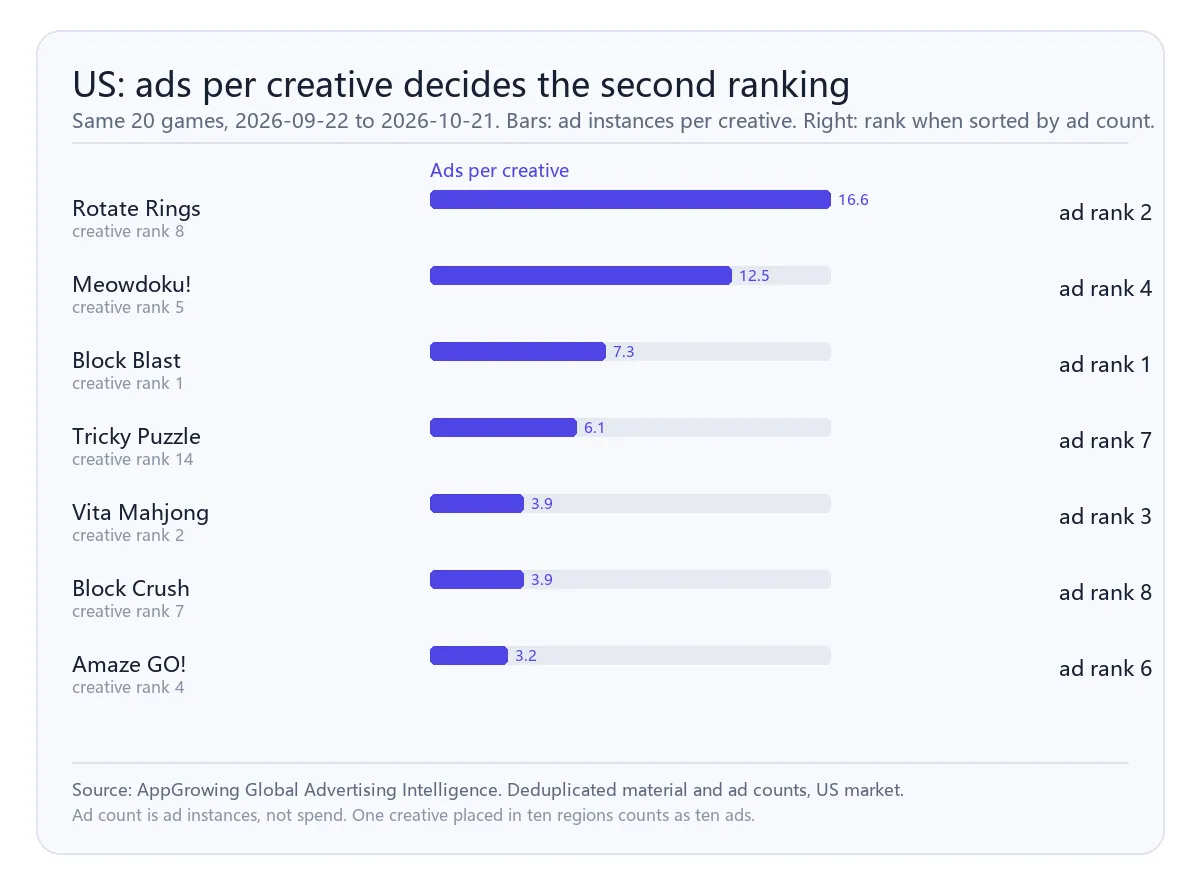
Take the same 20 US games and rank them by ad count instead of creative count, and the order changes immediately. Rotate Rings moves from 8th to 2nd, Tricky Puzzle from 14th to 7th, while Amaze GO slips from 4th to 6th. The reshuffle is not noise: it tracks the ads-per-creative ratio almost exactly — 16.6 for Rotate Rings, 6.1 for Tricky Puzzle, 3.2 for Amaze GO. One ranking measures production; the other measures replication.
How far apart are the two rankings?
In the US, Block Blast leads on ads with 316,960, followed by Rotate Rings at 166,342, Vita Mahjong at 165,821 and Meowdoku at 140,491. Vita Mahjong was second on creatives and drops to third on ads, 521 ad instances behind Rotate Rings.
Japan and Korea reorder the same way. Rotate Rings moves from 6th to 2nd in Japan. In Korea, the local title 제우스: 오만의 신 goes from 12th to 4th, producing 81,953 ads from 4,682 creatives.
US: ads per creative and the rank it produces
Which titles look bigger through an ad lens?
Three patterns. The first is a narrow library run hard: Rotate Rings sits at 16.6, 19.5 and 20.0 across the three markets, and the Korean local title 제우스: 오만의 신 at 17.5. The second is a mid-sized library run hard: Meowdoku, 10.8 to 13.2. The third is a leader with ordinary replication: Block Blast at 7.3 to 7.4, winning on base size rather than on repetition.
None of these stand out on a creative ranking, which is exactly why a creative-only watchlist misses them.
Which titles look smaller?
Block Crush is the clearest counter-example: 7th on US creatives, 8th on US ads, at a ratio of 3.9; in Korea it is 3rd on creatives and 8th on ads at 3.8. Amaze GO behaves the same way in Japan, 3rd on creatives and 8th on ads.
That is a broad-library, low-replication pattern: many creatives, few ad instances each. A creative ranking overstates these titles; an ad ranking understates them.
Does ad count work as a spend proxy?
No. Ad count here is the number of deduplicated ad IDs, not budget, not spend and not impressions. One creative placed in ten regions generates ten ads, so the count inflates with geographic breadth.
The only defensible inference is relative: within one market and one window, ads divided by creatives describes how many ad instances a team builds from the same library. Anything beyond that is overreach.
There is one practical exception. If two titles sit in the same market, the same window and the same ratio band, a large gap in ad count does suggest a difference in how broadly the library is being distributed — not how much money is behind it. That distinction matters when you brief a team: "they run a wider distribution" is defensible from this data; "they spend more" is not.
How should the two lists be used together?
Three steps. First, use the creative ranking to decide whose production you want to study. Second, use the ad ranking to see whether they are squeezing winners or building a library. Third, compare only within the same ratio band — cross-band comparisons produce conclusions that do not survive the next month.
What not to do: do not treat ad count as spend or as a proxy for intensity; do not read the gap between the two ranks as an efficiency gap; and do not generalise a single market's ad ranking to a global one.
Want both rankings for your market?
Get a free benchmark check based on your specific app or game category.
