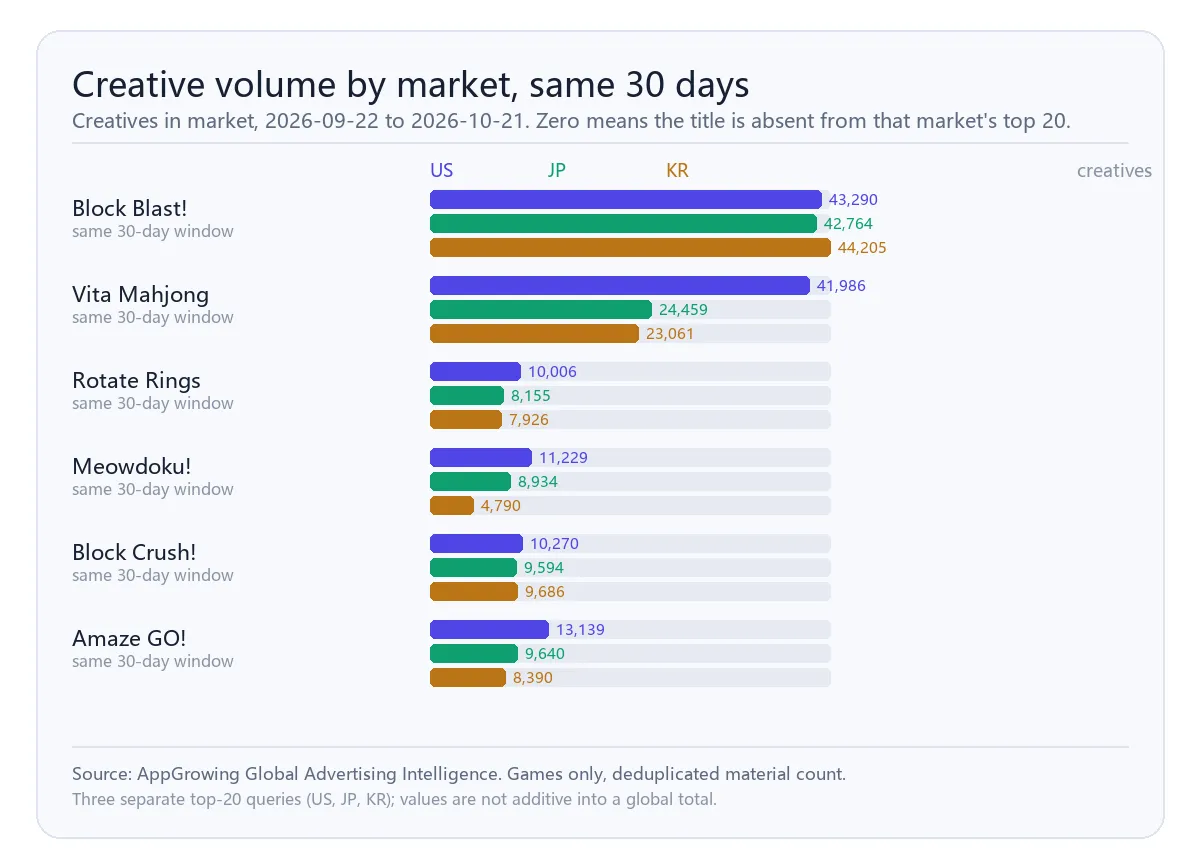
Block Blast ranks first by creative volume in all three markets covered here — 43,290 creatives in the US, 42,764 in Japan and 44,205 in Korea, within 3% of each other, with an ads-per-creative ratio of 7.3, 7.4 and 7.4. Across three top-10 lists there are only 13 distinct games, and 7 of them appear in all three. The head of this category is not localised market by market; one global creative library is being moved across markets, and real local differences only start below rank 10.
Who leads creative volume in each market?
The US top three are Block Blast, Vita Mahjong and Zen Word. Japan's are Block Blast, Vita Mahjong and Amaze GO. Korea's are Block Blast, Vita Mahjong and Block Crush. The first two positions are identical everywhere; the split starts at third.
Sixty ranking slots across three markets resolve to 30 distinct game brands. That level of overlap points to one production pipeline feeding all three markets rather than three separate libraries.
Top-10 union across the three markets
| # | Game | US | JP | KR |
|---|---|---|---|---|
| 1 | Block Blast! | #1 · 43,290 | #1 · 42,764 | #1 · 44,205 |
| 2 | Vita Mahjong | #2 · 41,986 | #2 · 24,459 | #2 · 23,061 |
| 3 | Zen Word® - Relax Puzzle Game | #3 · 13,237 | — | — |
| 4 | Amaze GO! | #4 · 13,139 | #3 · 9,640 | #4 · 8,390 |
| 5 | Meowdoku! | #5 · 11,229 | #5 · 8,934 | #11 · 4,790 |
| 6 | Jigsawcard Solitaire Puzzle | #6 · 10,698 | #10 · 6,550 | #10 · 4,833 |
| 7 | Block Crush! | #7 · 10,270 | #4 · 9,594 | #3 · 9,686 |
| 8 | Rotate Rings | #8 · 10,006 | #6 · 8,155 | #5 · 7,926 |
| 9 | OOC: The Playable Anime | #9 · 8,956 | — | — |
| 10 | Mahjong Blast | #10 · 8,063 | #9 · 6,594 | #7 · 6,814 |
| 11 | Crazy Brain Puzzle: Mind Twist | #12 · 7,703 | #7 · 7,613 | #6 · 7,632 |
| 12 | Tricky Puzzle: Brain Quest | #14 · 6,735 | #8 · 6,766 | #8 · 6,597 |
| 13 | Tricky Puzzle 2: Brain Test | #17 · 6,111 | #11 · 6,103 | #9 · 6,105 |
Which title is the most global, and which is the most US-weighted?
Block Blast is the most consistent: near-identical volume and an identical ads-per-creative ratio in all three markets, which is what a single library with a single replication setting looks like.
Vita Mahjong is the most US-weighted: {VM['us'][1]:,} creatives in the US against {VM['jp'][1]:,} in Japan and {VM['kr'][1]:,} in Korea — 1.7 to 1.8 times the other two markets in the same window. The product is the same; the pool behind it is not.
Two titles appear only in the US top 10: Zen Word (3rd, {ZC['us'][1]:,}) and OOC (9th, {MARKET['us']['"OOC: The Playable Anime"'][1]:,}). Neither appears anywhere in the Japanese or Korean top 20.
Why does the ads-per-creative ratio barely move across markets?
Block Blast sits at 7.3 / 7.4 / 7.4, Meowdoku at 12.5 / 10.8 / 13.2, Rotate Rings at 16.6 / 19.5 / 20.0. A stable ratio means replication intensity travels with the creative library, not with the market.
If media plans were built market by market, that ratio should widen with local competition. It barely moves, which suggests the team treats "how many ads per creative" as a global setting. That single decision explains most of the ranking similarity.
Where does localisation actually happen?
At the bottom of each list. Korea's 12th place (제우스: 오만의 신, 4,682) and 20th (라스트 라이트: 디펜스, 3,308) do not appear in the US or Japanese rankings, and Japan's Screwdom (3,904) appears in neither of the others. These are genuinely local products, at roughly a tenth of the leader's volume.
So localisation budget sits in the long tail while the head runs on a global library. For competitor monitoring that maps to a simple rule: read structures at the top, read local opportunity at the bottom.
How should a UA team use a three-market view?
Three steps. First, check top-10 overlap: high overlap means the category runs on a global library and does not need per-market creative rebuilds. Second, find titles whose local rank sits well below their regional peers — that gap is the localisation hole and the cheapest place to differentiate. Third, scout the bottom of each list for local competitors, because that is where market-specific structures live.
What not to do: do not add the three markets together to claim a global total (these are three separate top-20 queries, not a global market size), do not read creatives as new creatives, and do not infer CPI, CTR or retention — none of those fields were returned.
Want this three-market view for your genre?
Get a free benchmark check based on your specific app or game category.