Here is AppGrowing's analysis of the global mobile App advertising markets in February 2024, based on advertising data from 25 global media platforms in 50 countries/regions.
01 Advertising Trends
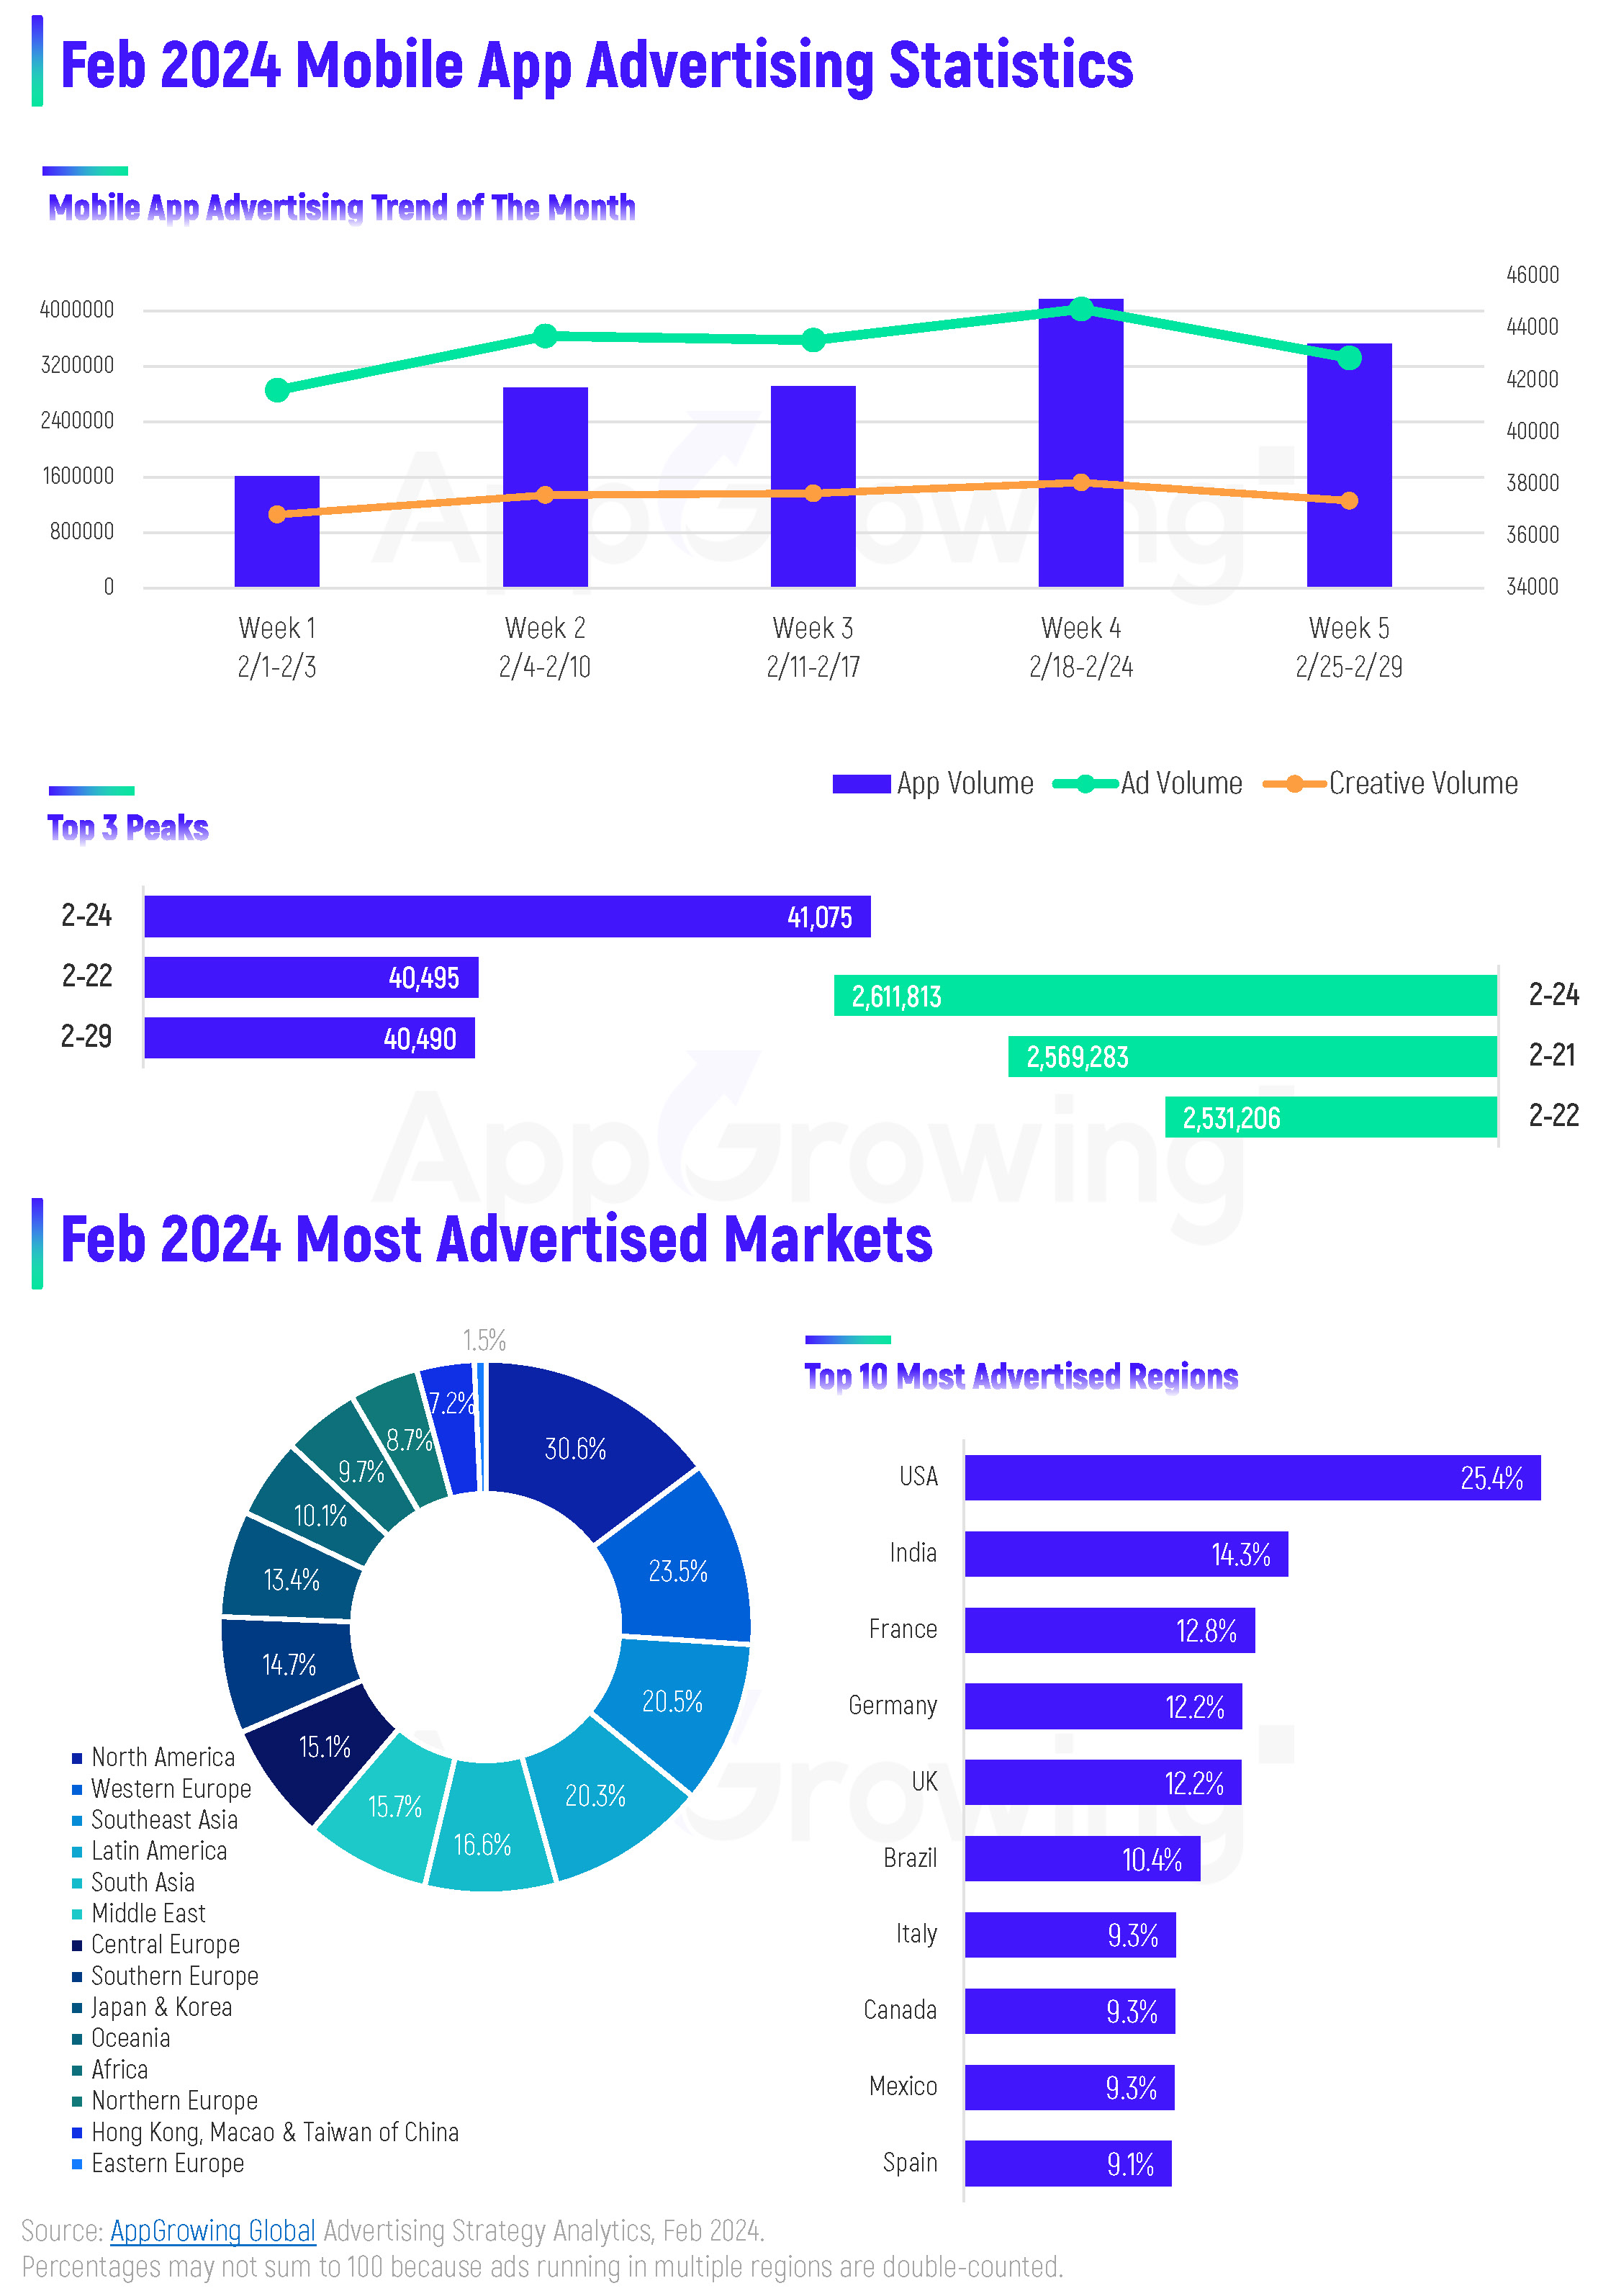
Weekly, February 2024 saw fluctuations in global App Ad Volume. Week 4 showed the most, close to 4M, and also the most in terms of App Volume, over 44K. Creative Volume grew marginally, at over 800K per week.
In terms of a single day, the peak in Ad Volume and App Volume occurred in the latter part of the month, both on February 24th. Ad Volume amounted to 261M and App Volume was 41,075.
Regionally, the Top 3 regions in terms of Ad Volume are North America, Western Europe, and Southeast Asia. Latin America accounted for more than 20% of the Ad Volume. Specifically, the Top 5 regions are the USA, India, France, Germany and the UK. Brazil accounted for more than 10% of the Ad Volume.
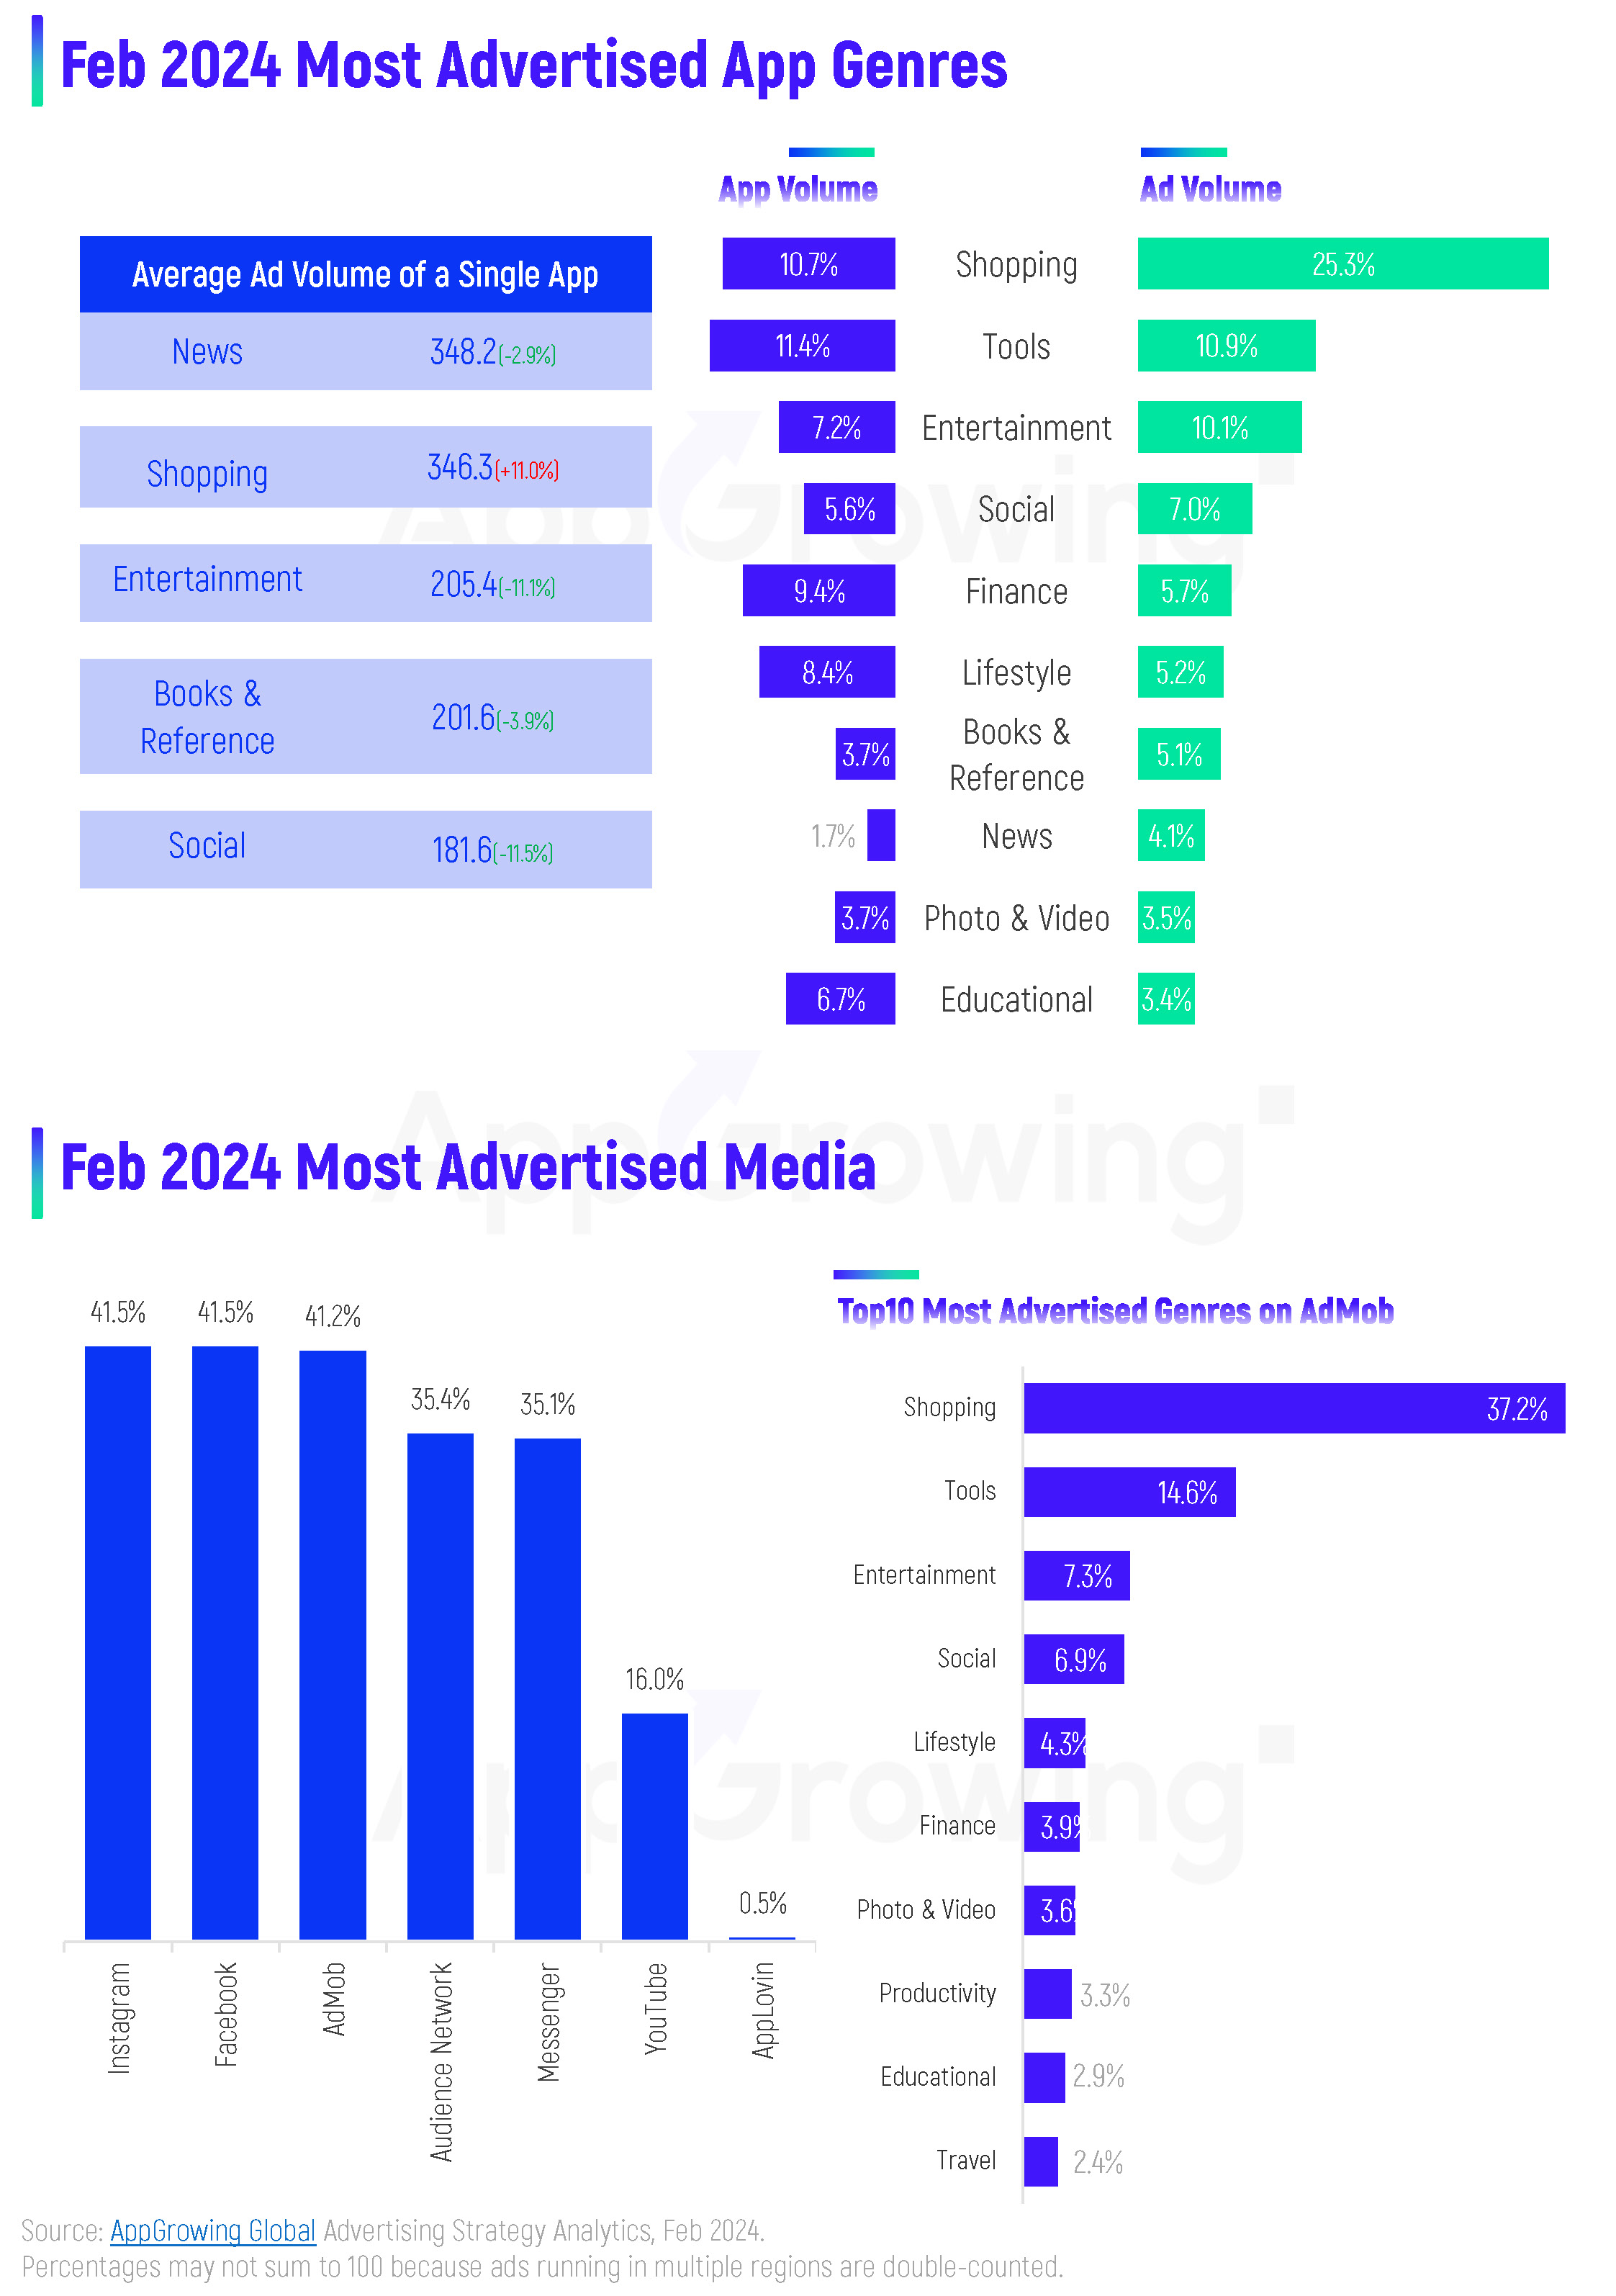
As for categories, Shopping continues growing in Ad Volume, ranking No. 1 with a 25.3% share, well ahead of Tools, which is No. 2. It took 2nd place in terms of App Volume at 10.7%. The 1st category for App Volume was still Tools at 11.4%. On the average ad volume for a single App, News remained No. 1, though it fell further to 348.2. It was followed by Shopping, Entertainment, Books & Reference, and Social. Except for Shopping, the figures have all dropped.
Take a look at the media. According to AppGrowing, Instagram jumped to No. 1 in Ad Volume for February. Facebook, AdMob, and Meta Audience Network were close behind. The Top 3 all accounted for more than 40% of Ad Volume. Specifically on AdMob, Shopping, News, Books & Reference, Entertainment, and Finance were the Top 5 categories in terms of Ad Volume, with Shopping accounting for a whopping 37.2% of the total.
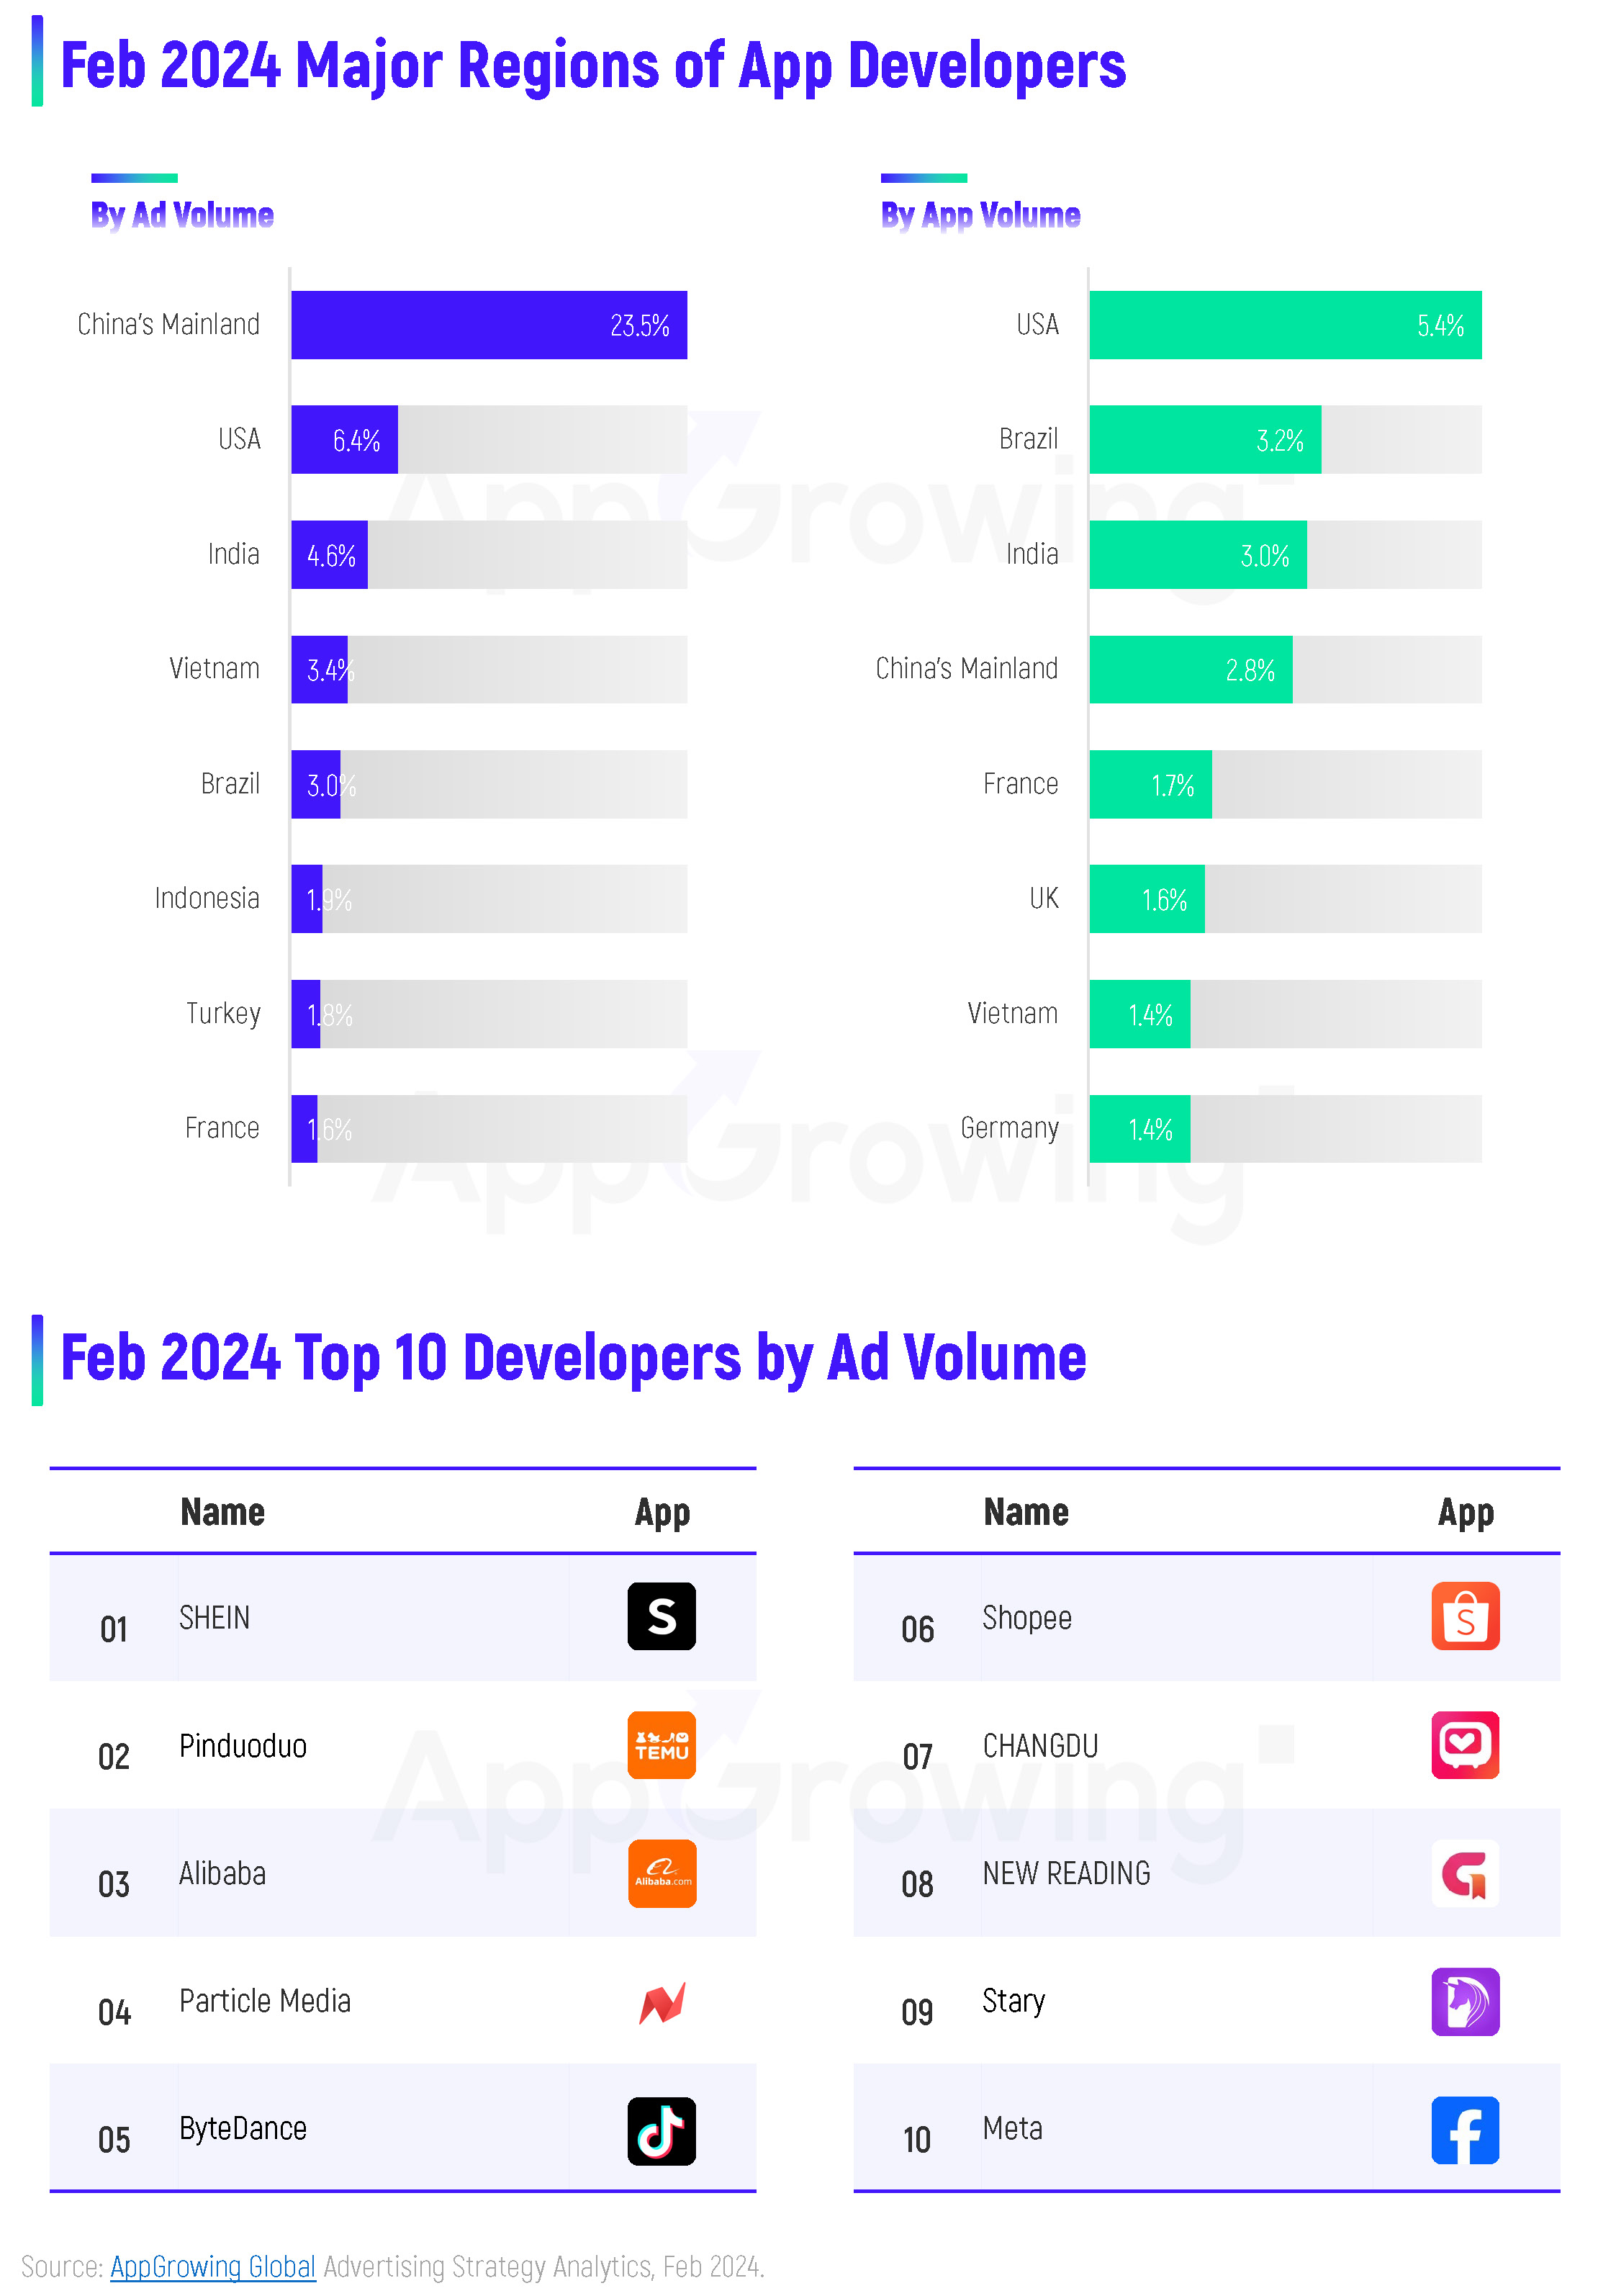
China's Mainland continues leading the way in terms of App developer regions, with 23.5% of ads in February. the USA is still the Top 1 in terms of App Volume, with 5.4%. Brazil ranked No. 2 for App Volume and No. 5 for Ad Volume.
Among the Top 10 Most Advertised Developers in February, the Top 3 were all e-commerce companies from China, namely SHEIN, Pinduoduo, and Alibaba. Shopee was also on the list in Shopping. Moreover, China's Mainland developers ByteDance, CHANGDU, NEW READING, and Stary, which mainly specialize in pan-entertainment apps, are also on the list.
02 Most Advertised Apps
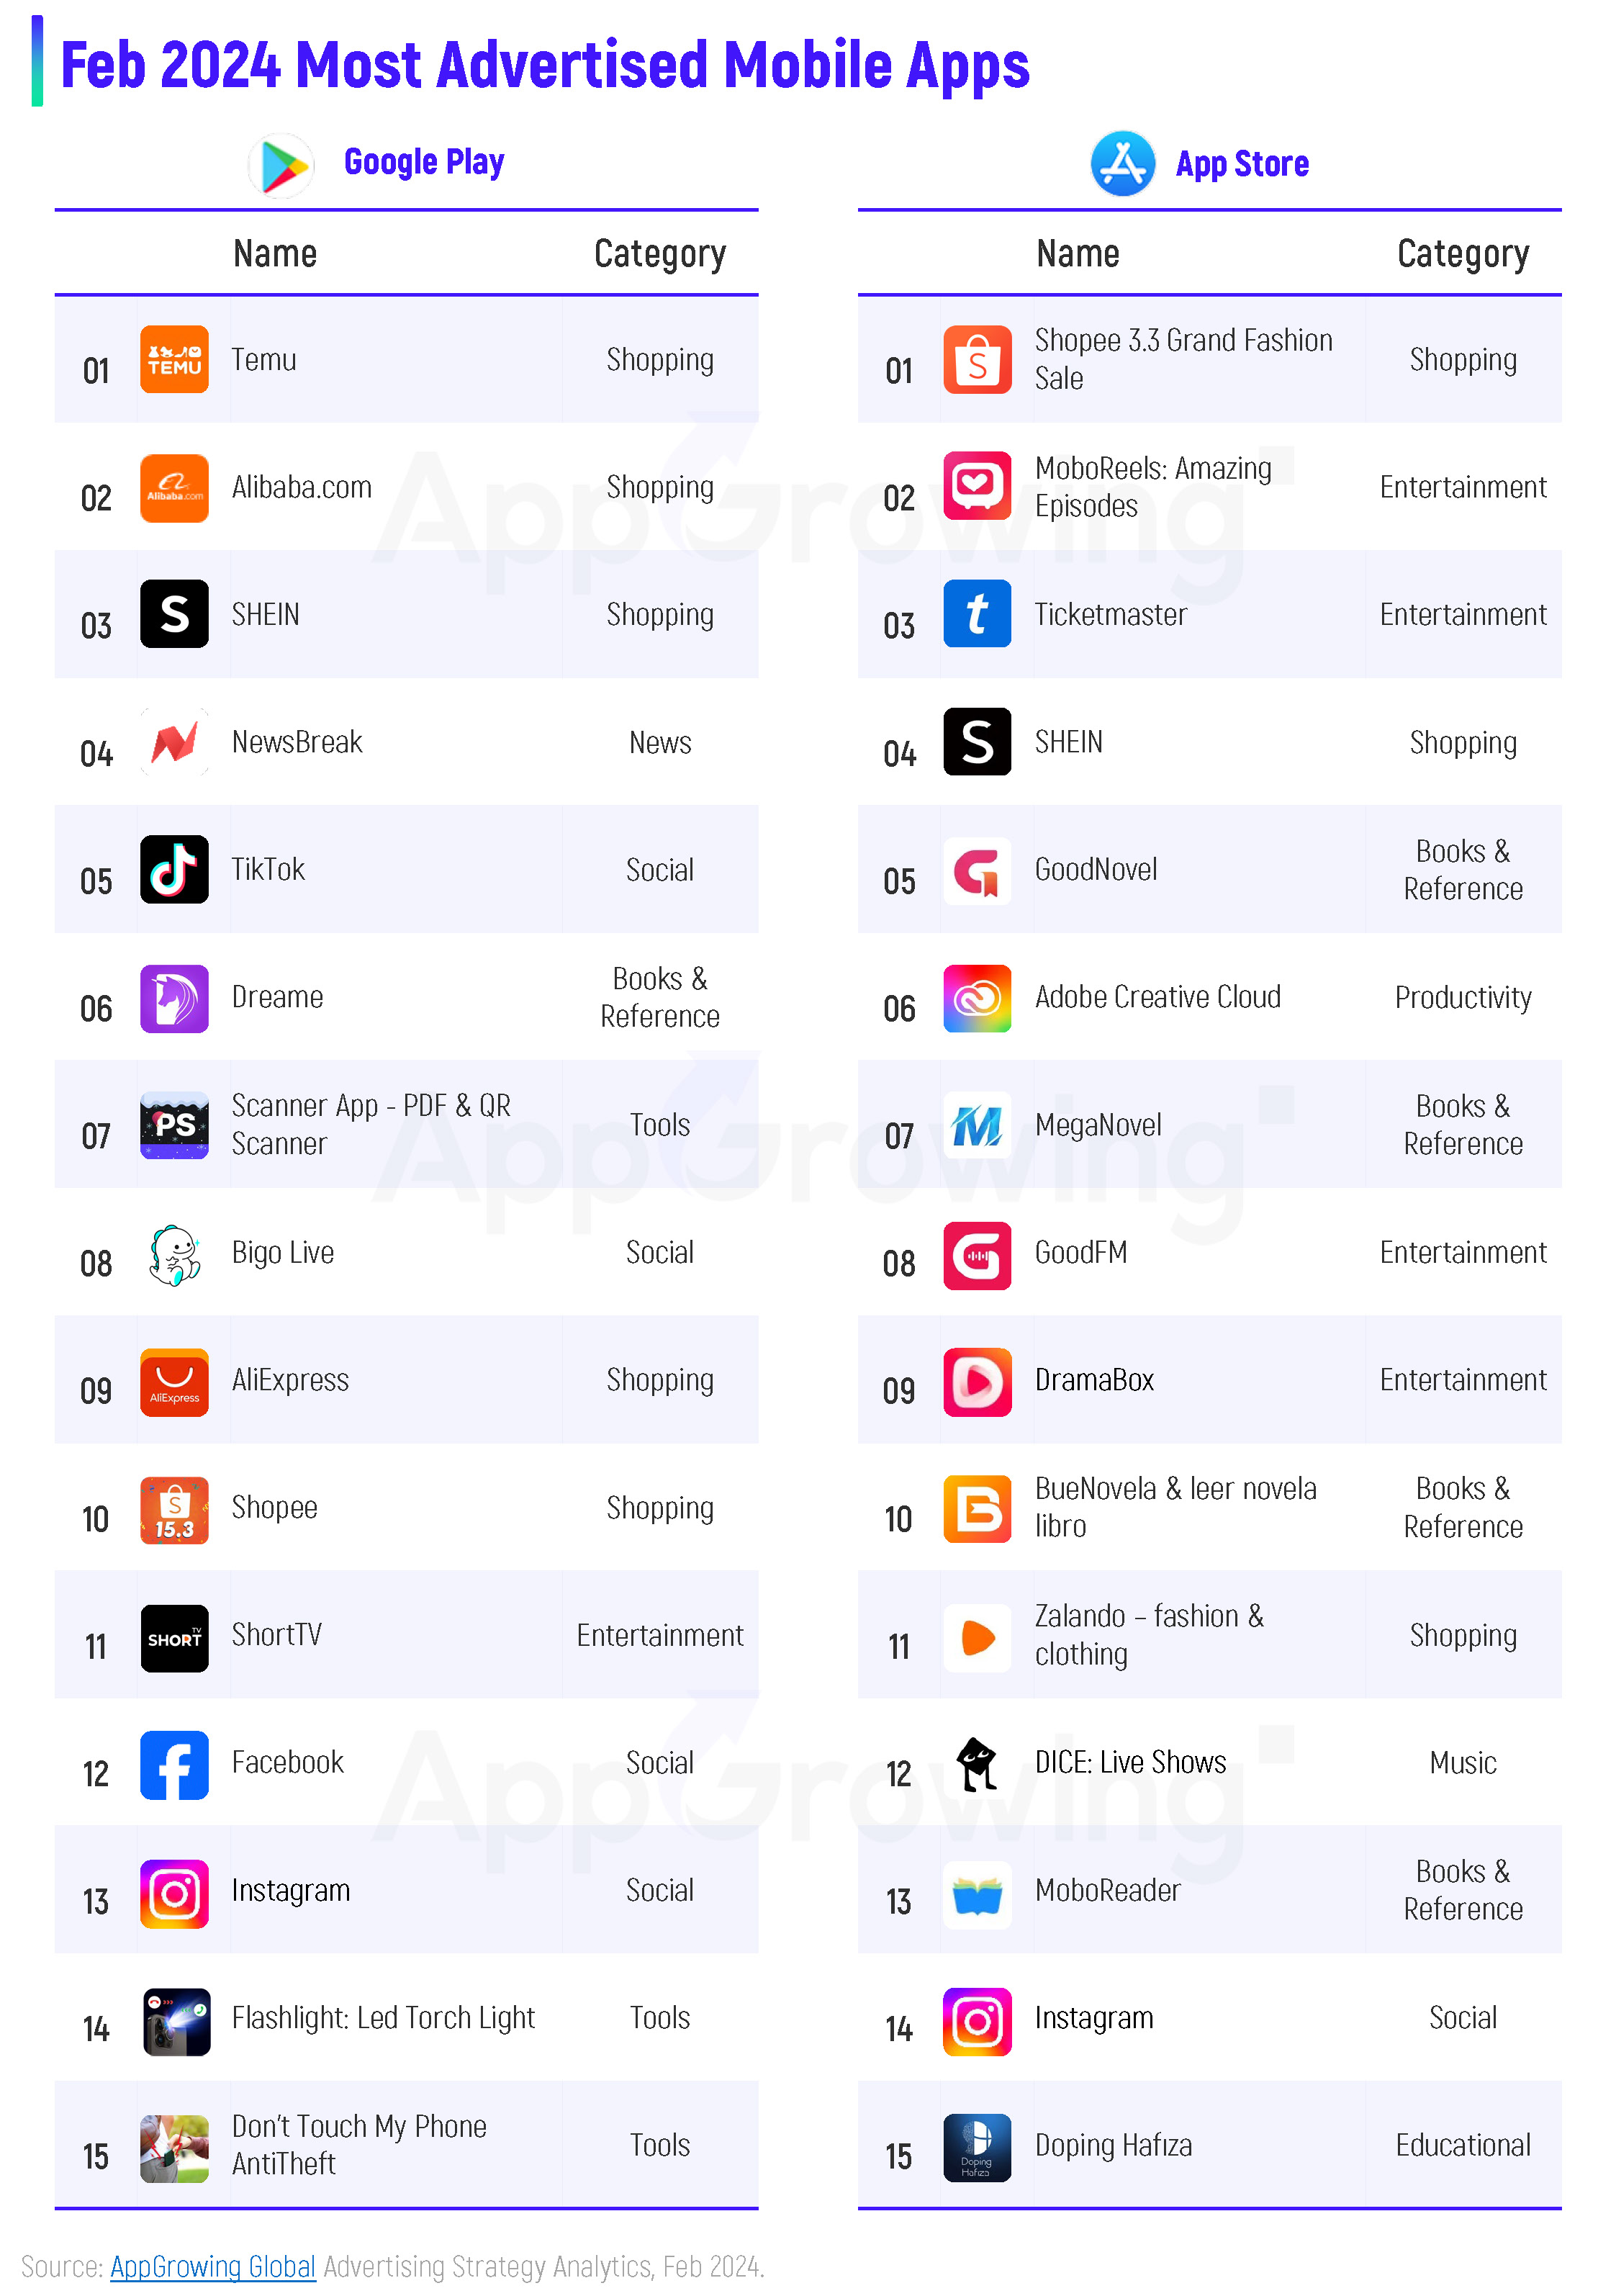
Shopping took the Top 1 on both Google Play and iOS. The winners were TUMU and Shopee, respectively. Leading shopping apps kept massive ads. Another 3 Shopping apps made it to the Top 10, namely Alibaba.com, SHEIN, and AliExpress.
Social apps continue making the most of the Google Play charts, with 4 apps in total. Tools and Shopping followed, with 3 apps in the Top 10 each.
On App Store, Entertainment and Books & Reference charted the most, with four each. Short drama apps maintained a steady mass of ads, with MoboReels coming in at No. 2. In addition, a Shopping app, Zalando, is new to the list, coming in at No. 11.
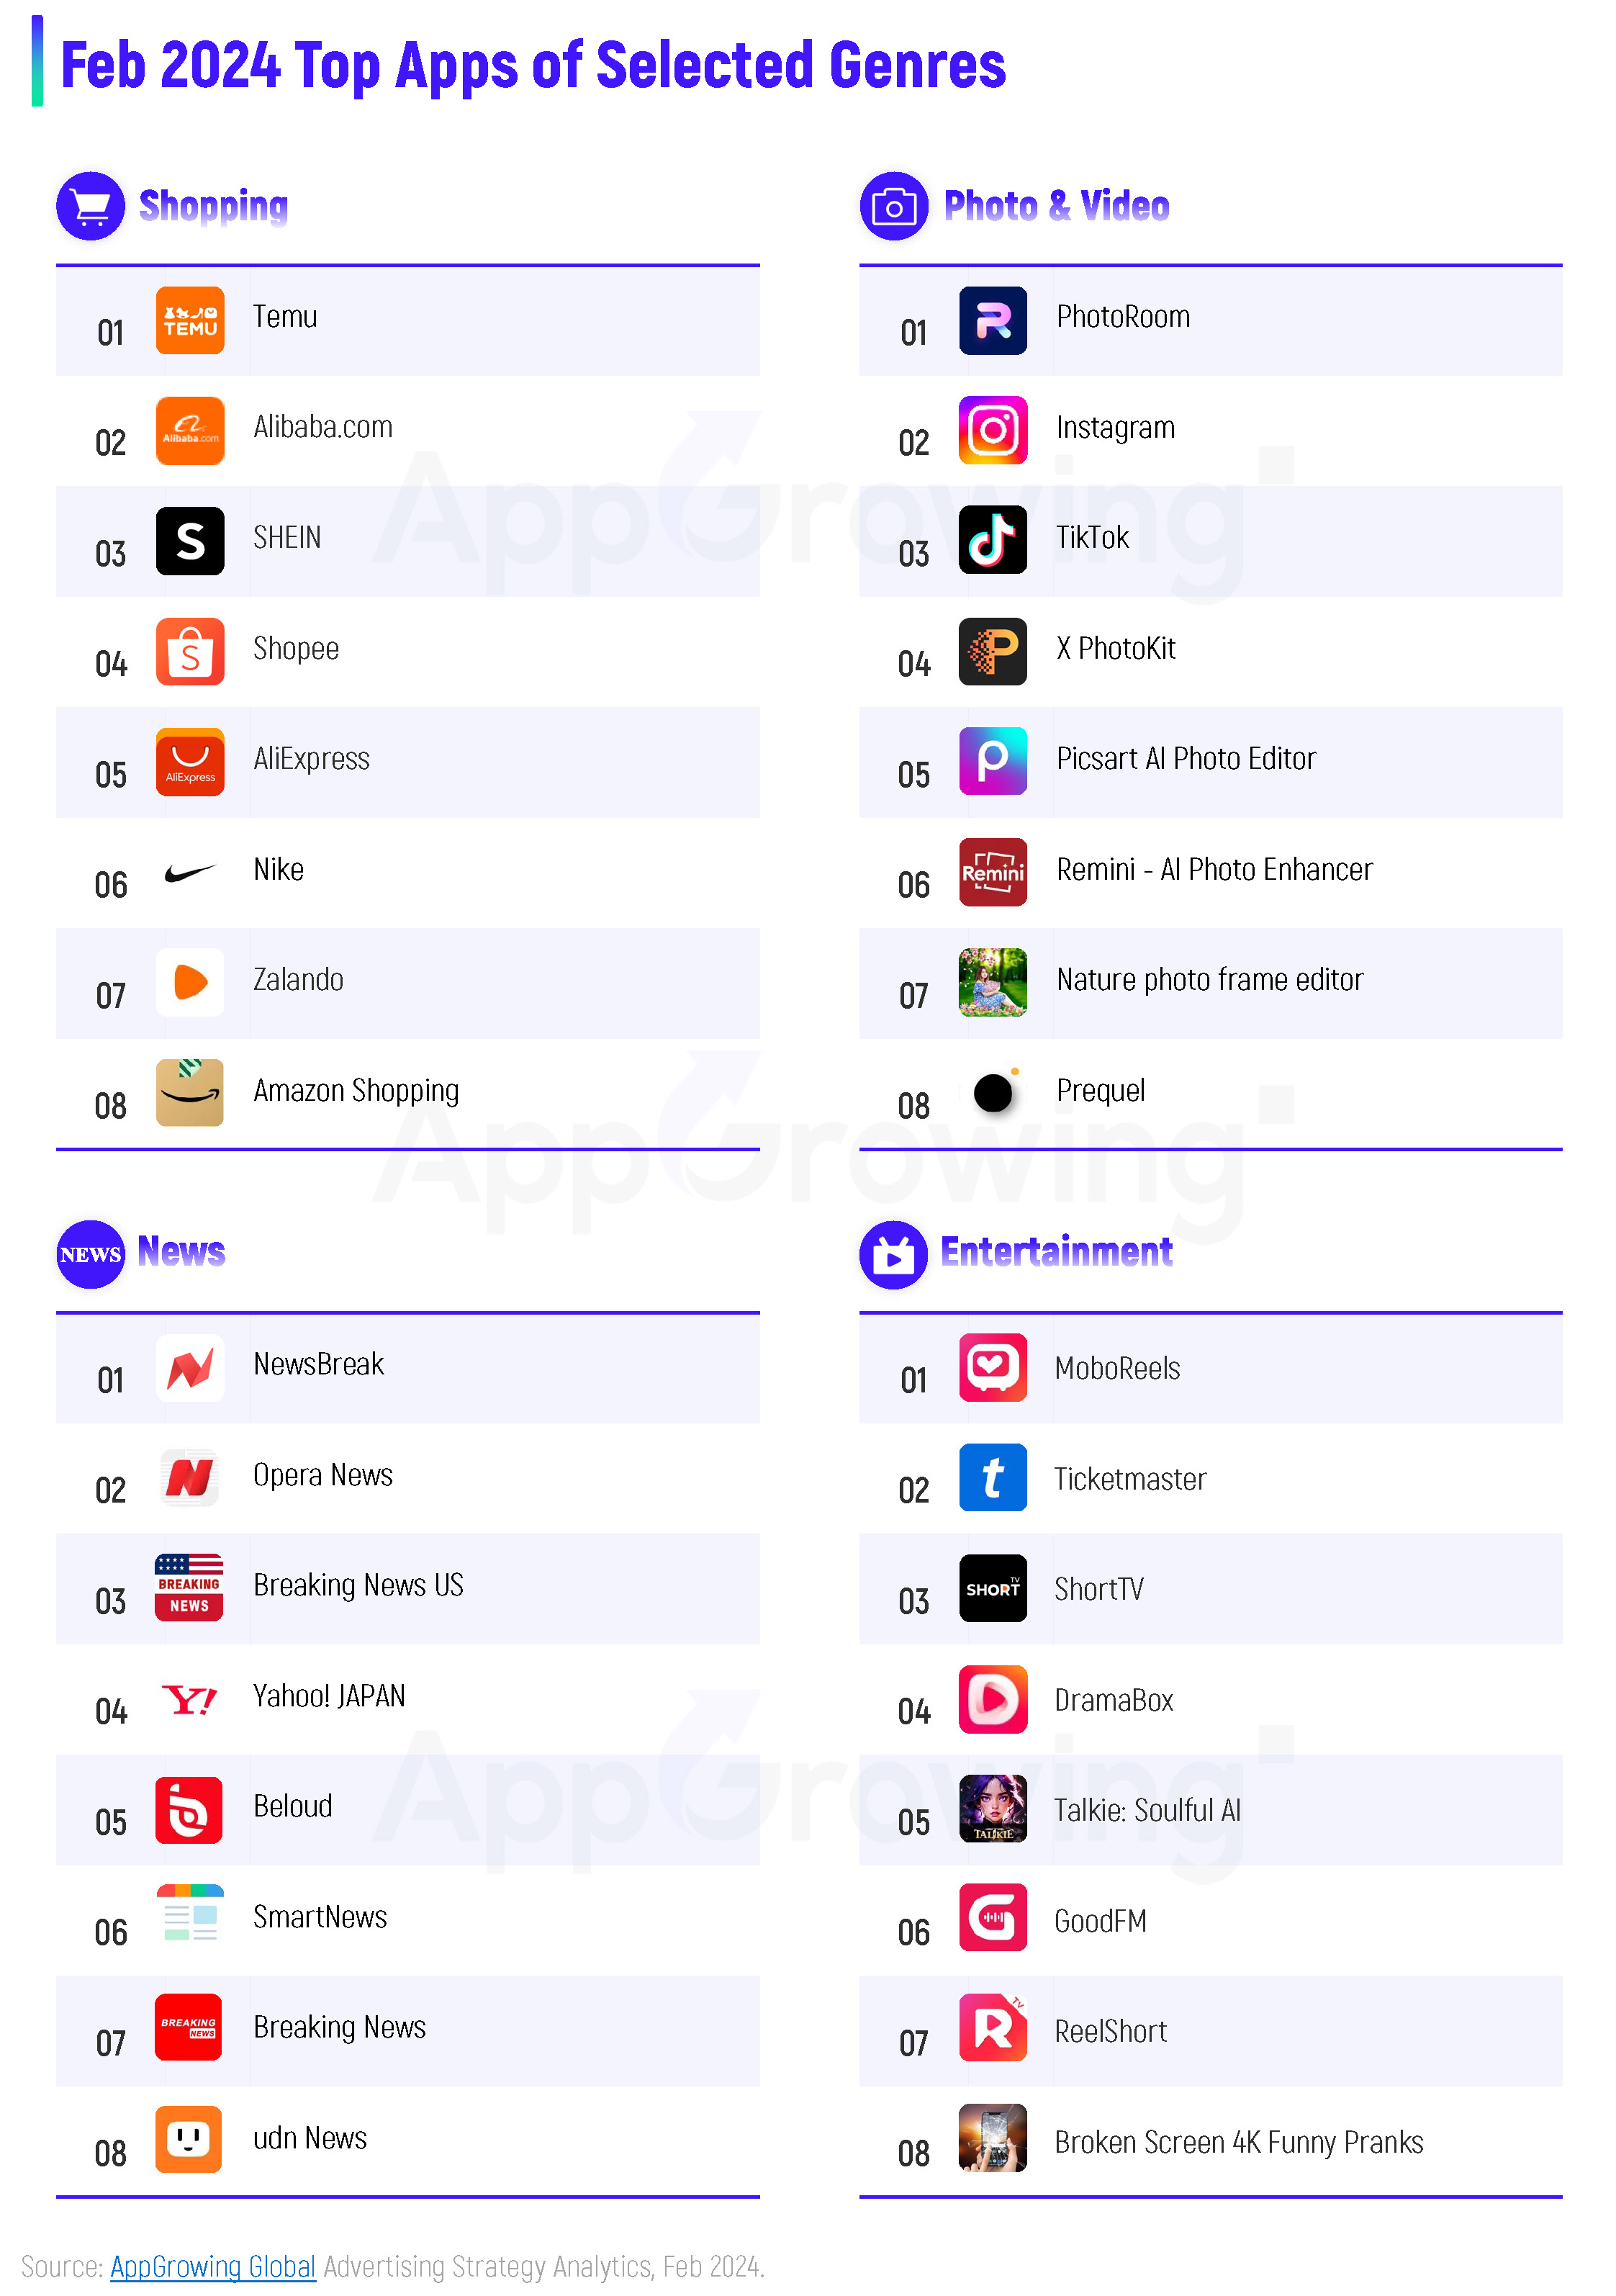
In February AppGrowing selected four categories - Shopping, Photo & Video, News, and Entertainment - and ranked each by Ad Volume.
Shopping has kept massive ads since last November. As you can see, Chinese developers are the main force, with the Top 3 being TEMU, Alibaba.com, and SHEIN. Two AIGC-related apps appeared in the Top 8 of the Photo & Video category, namely Picsart and Remini.
Most of the Top 8 in News are "familiar faces". Local news apps such as Breaking News US and Yahoo! JAPAN saw more ads. In the Entertainment category, there are a lot of short drama apps, with MoboReels at the Top 1.
03 Case Analysis
Case 1: Lemon8
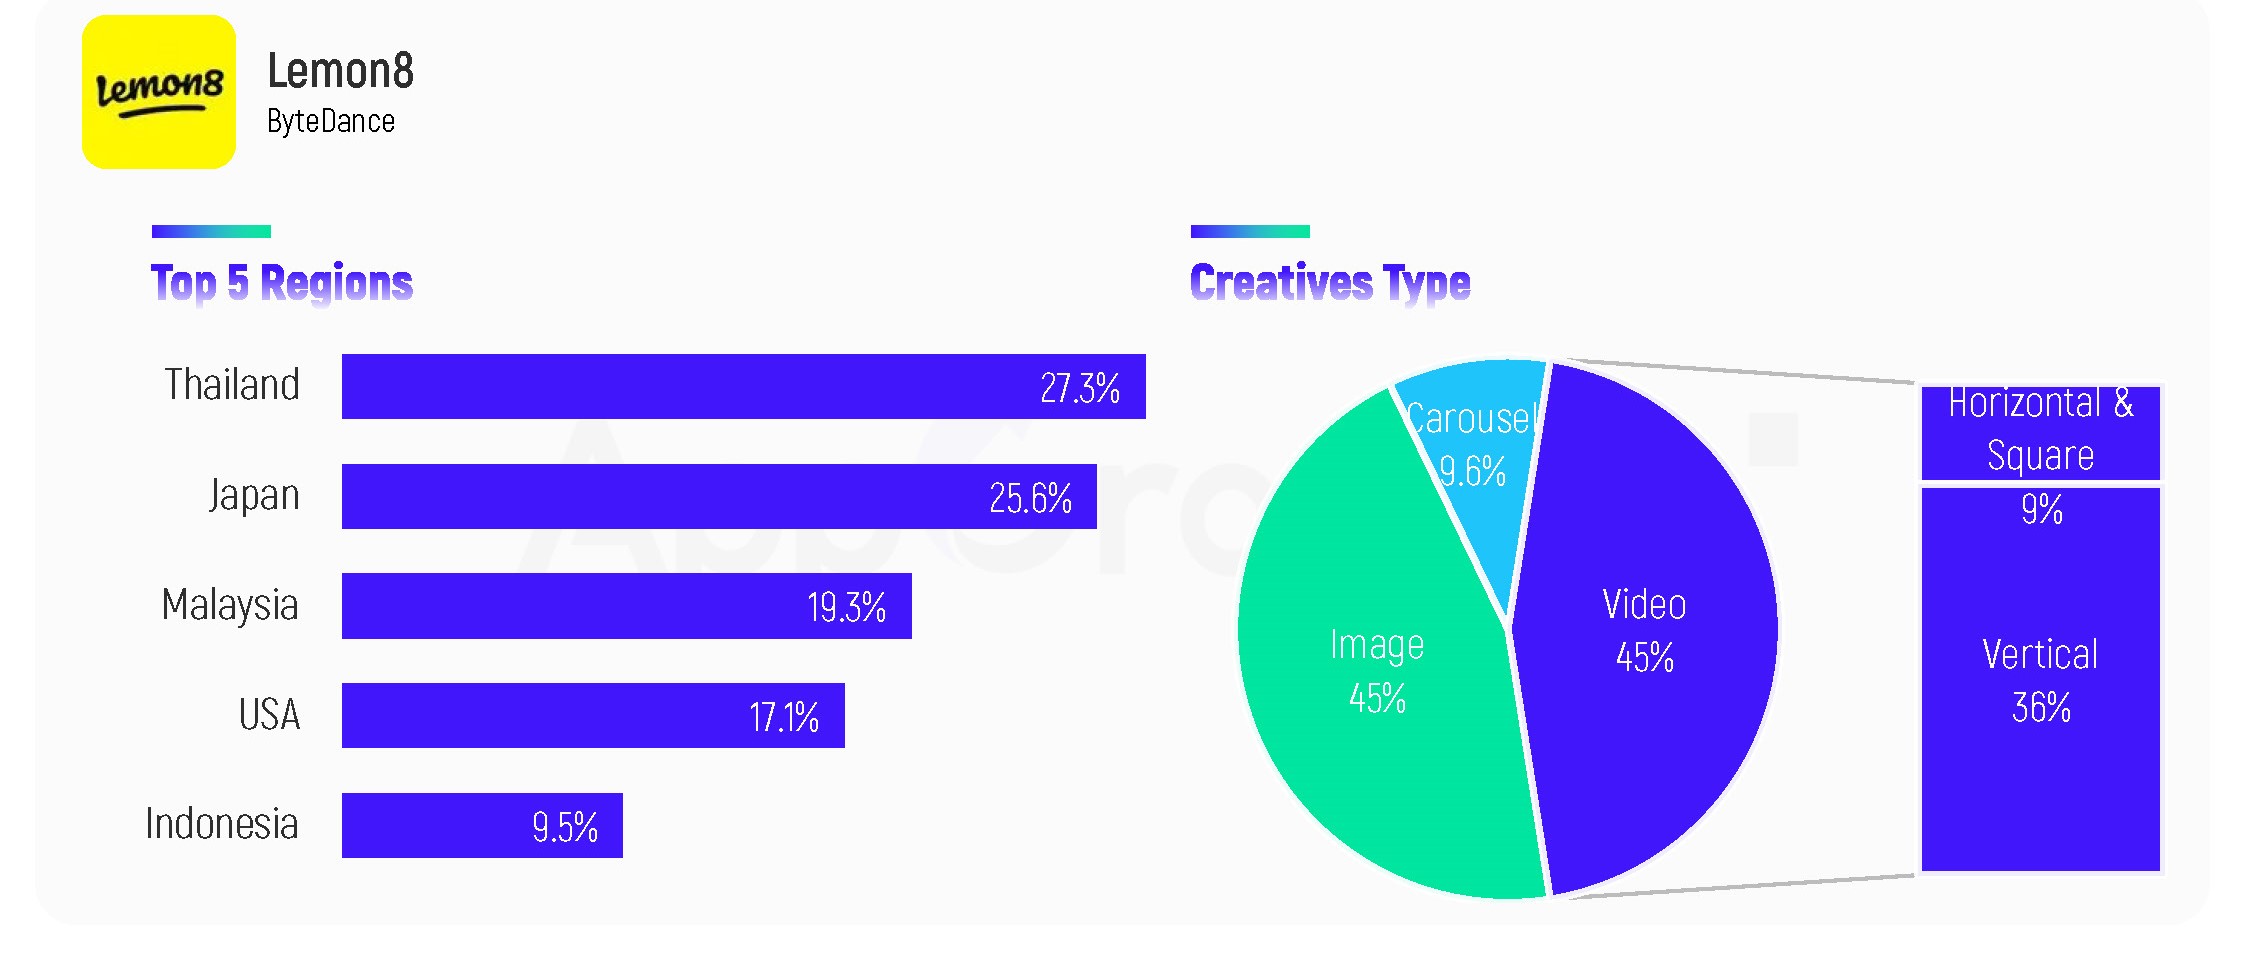
Lemon8 is a lifestyle community app launched by ByteDance, which is similar to Xiaohongshu in China's Mainland with content such as clothing, food and life sharing. The app has been online for 4 years, but the market performance is not impressive enough. However, ByteDance has recently increased the scale of advertising. AppGrowing monitored that in February, the main ad regions of Lemon8 were Asia and the USA, with Top5 being Thailand, Japan, Malaysia, the USA, and Indonesia. In terms of creative form, images and videos are dominant, with both accounting for 45% of the total.
In terms of creative content, Lemon8 mainly attracts users with UGC. There is a high proportion of live-action elements. For example, in the video below, the home decorating blogger introduces furniture design knowledge. The video intersperses the first viewpoint of paper teaching with the classic two-in-one live-action recommendation screen. It enriches the camera format, reduces visual fatigue, and reflects the rich PGC in the app, attracting downloads.
Pop quizzes are effective in engaging users. The video begins with the question "Do you know what face shape you have?" to attract female users. Then, the actress shows the steps and results of the test using the app. The fun tool sparks curiosity and a desire to try it, which drives downloads.
Case 2: Grab: Taxi Ride, Food Delivery
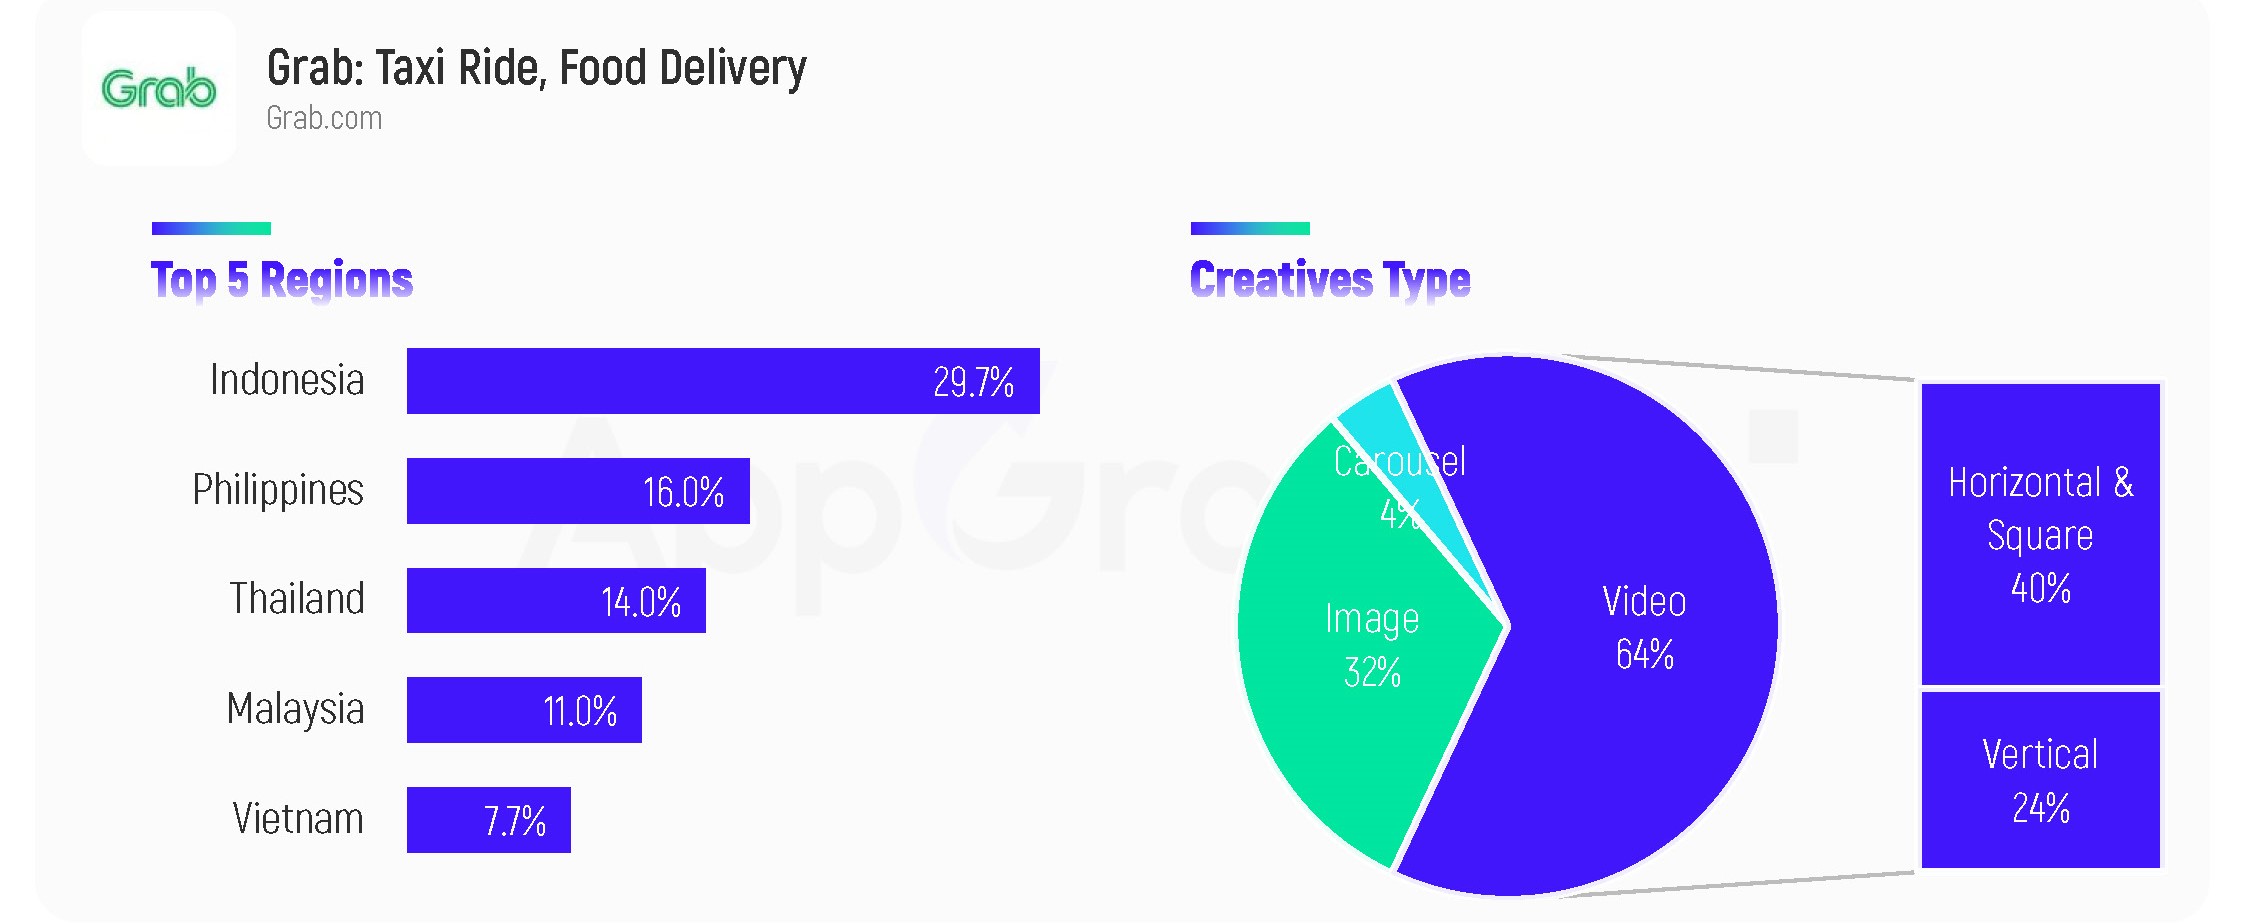
Grab, an app from a Southeast Asian developer, is a collection of taxi, takeaway, and other lifestyle features. AppGrowing monitored that the Top 5 ad regions for Grab in February were Indonesia, Philippines, Thailand, Malaysia, and Vietnam. The creative type is mainly video, with 40% of horizontal and square.
Creatively, Southeast Asian users have a clear preference for live-action elements. That's why Grab has released a large number of such ads. For example, the video shows the friends using the app in their lives. The first one booked a cab, and the second one ordered a takeaway on the app. The dialogues lead to the introduction of features and discounts, attracting users to download the app.
Some live-action videos draw viewers in with dramatic conflicts and reversals. The video consists of several shots of people using the app, glancing at the phone and immediately passing out from shock. The impactful images and suspense are intriguing. The final reveal of the surprise is a discount, and the actors are woken up again, adding a sense of comedy and deepening the user's impression of the brand.
