Here is AppGrowing's analysis of the global mobile App advertising markets in August 2023, based on advertising data from 25 global media platforms in 50 countries/regions.
01 Advertising Trends
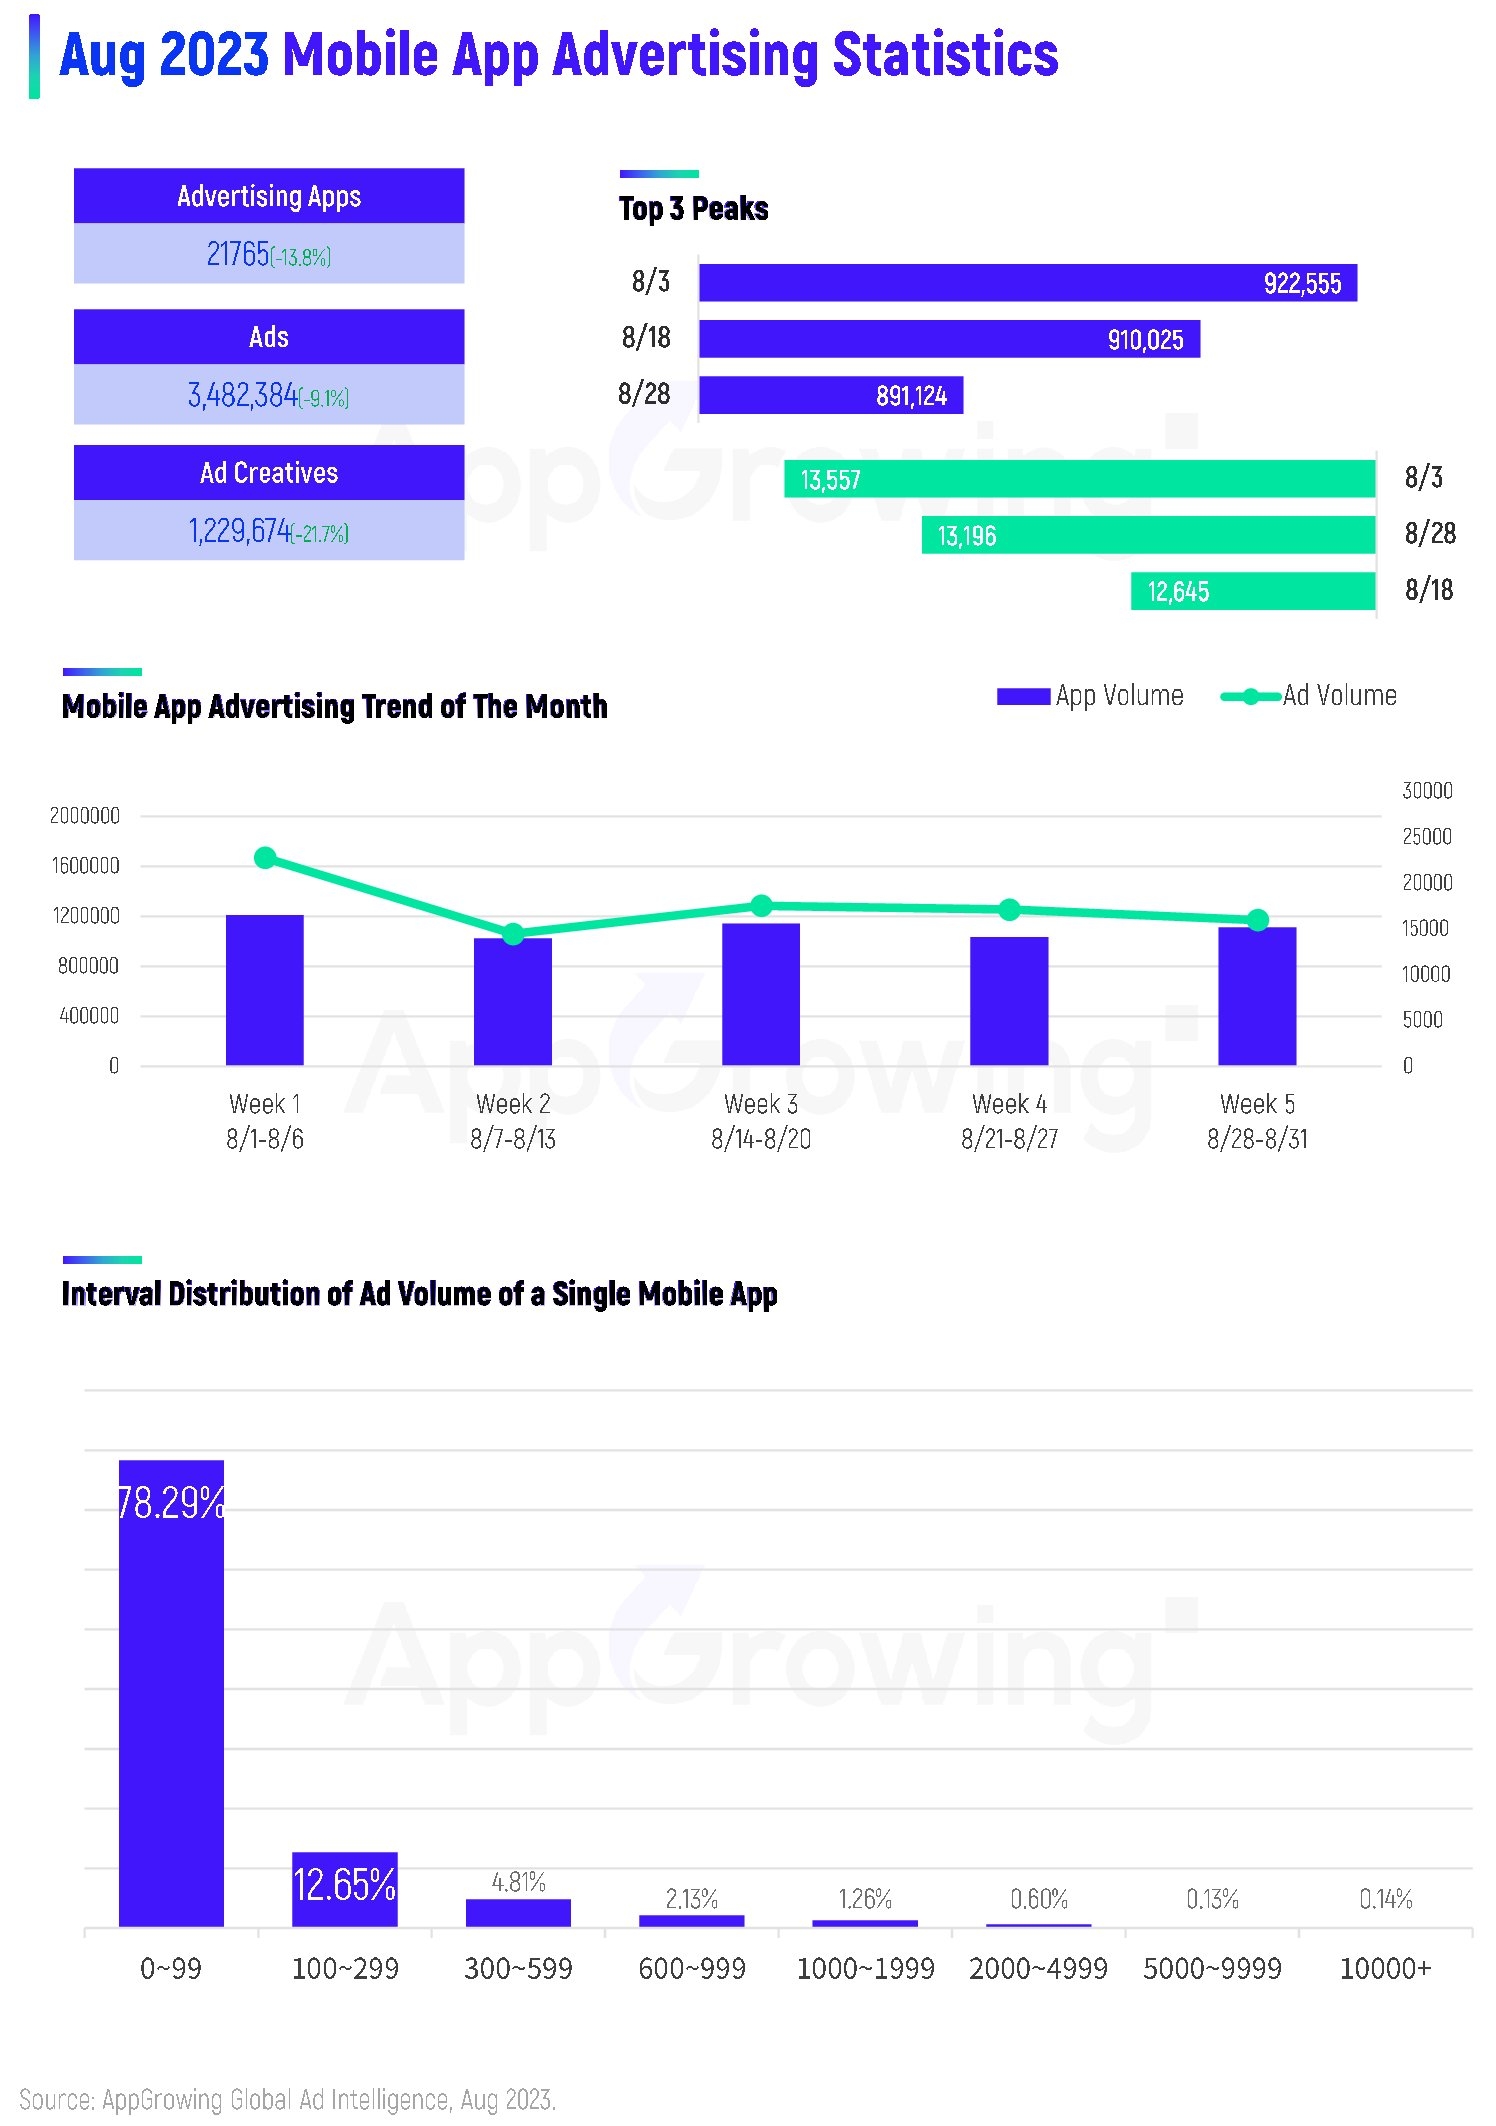
In August 2023, App Volume was 21,765, a decrease of 13.8% compared to July. Ad Volume was 3.48M+. Ad Creative Volume was 1.22M+, down 21.7% YoY.
Ad Volume and App Volume were concentrated in the latter half of the month, though the peak single-day numbers for both occurred on August 3, with over 920K million ads and 13,557 Apps.
On a weekly basis, App Volume stayed at 80K+ per week, with Week 1 approaching 120K. Weekly Ad Volume trended significantly downward, with a peak of over 1.60M in Week 1, and then plummeting to less than 1.20M in Week 2.
As for the distribution of the Ads of single apps, 78.29% are concentrated in the range of 0 to 99; 12.65% are in the range of 100 to 299, which is a slight increase compared with July.
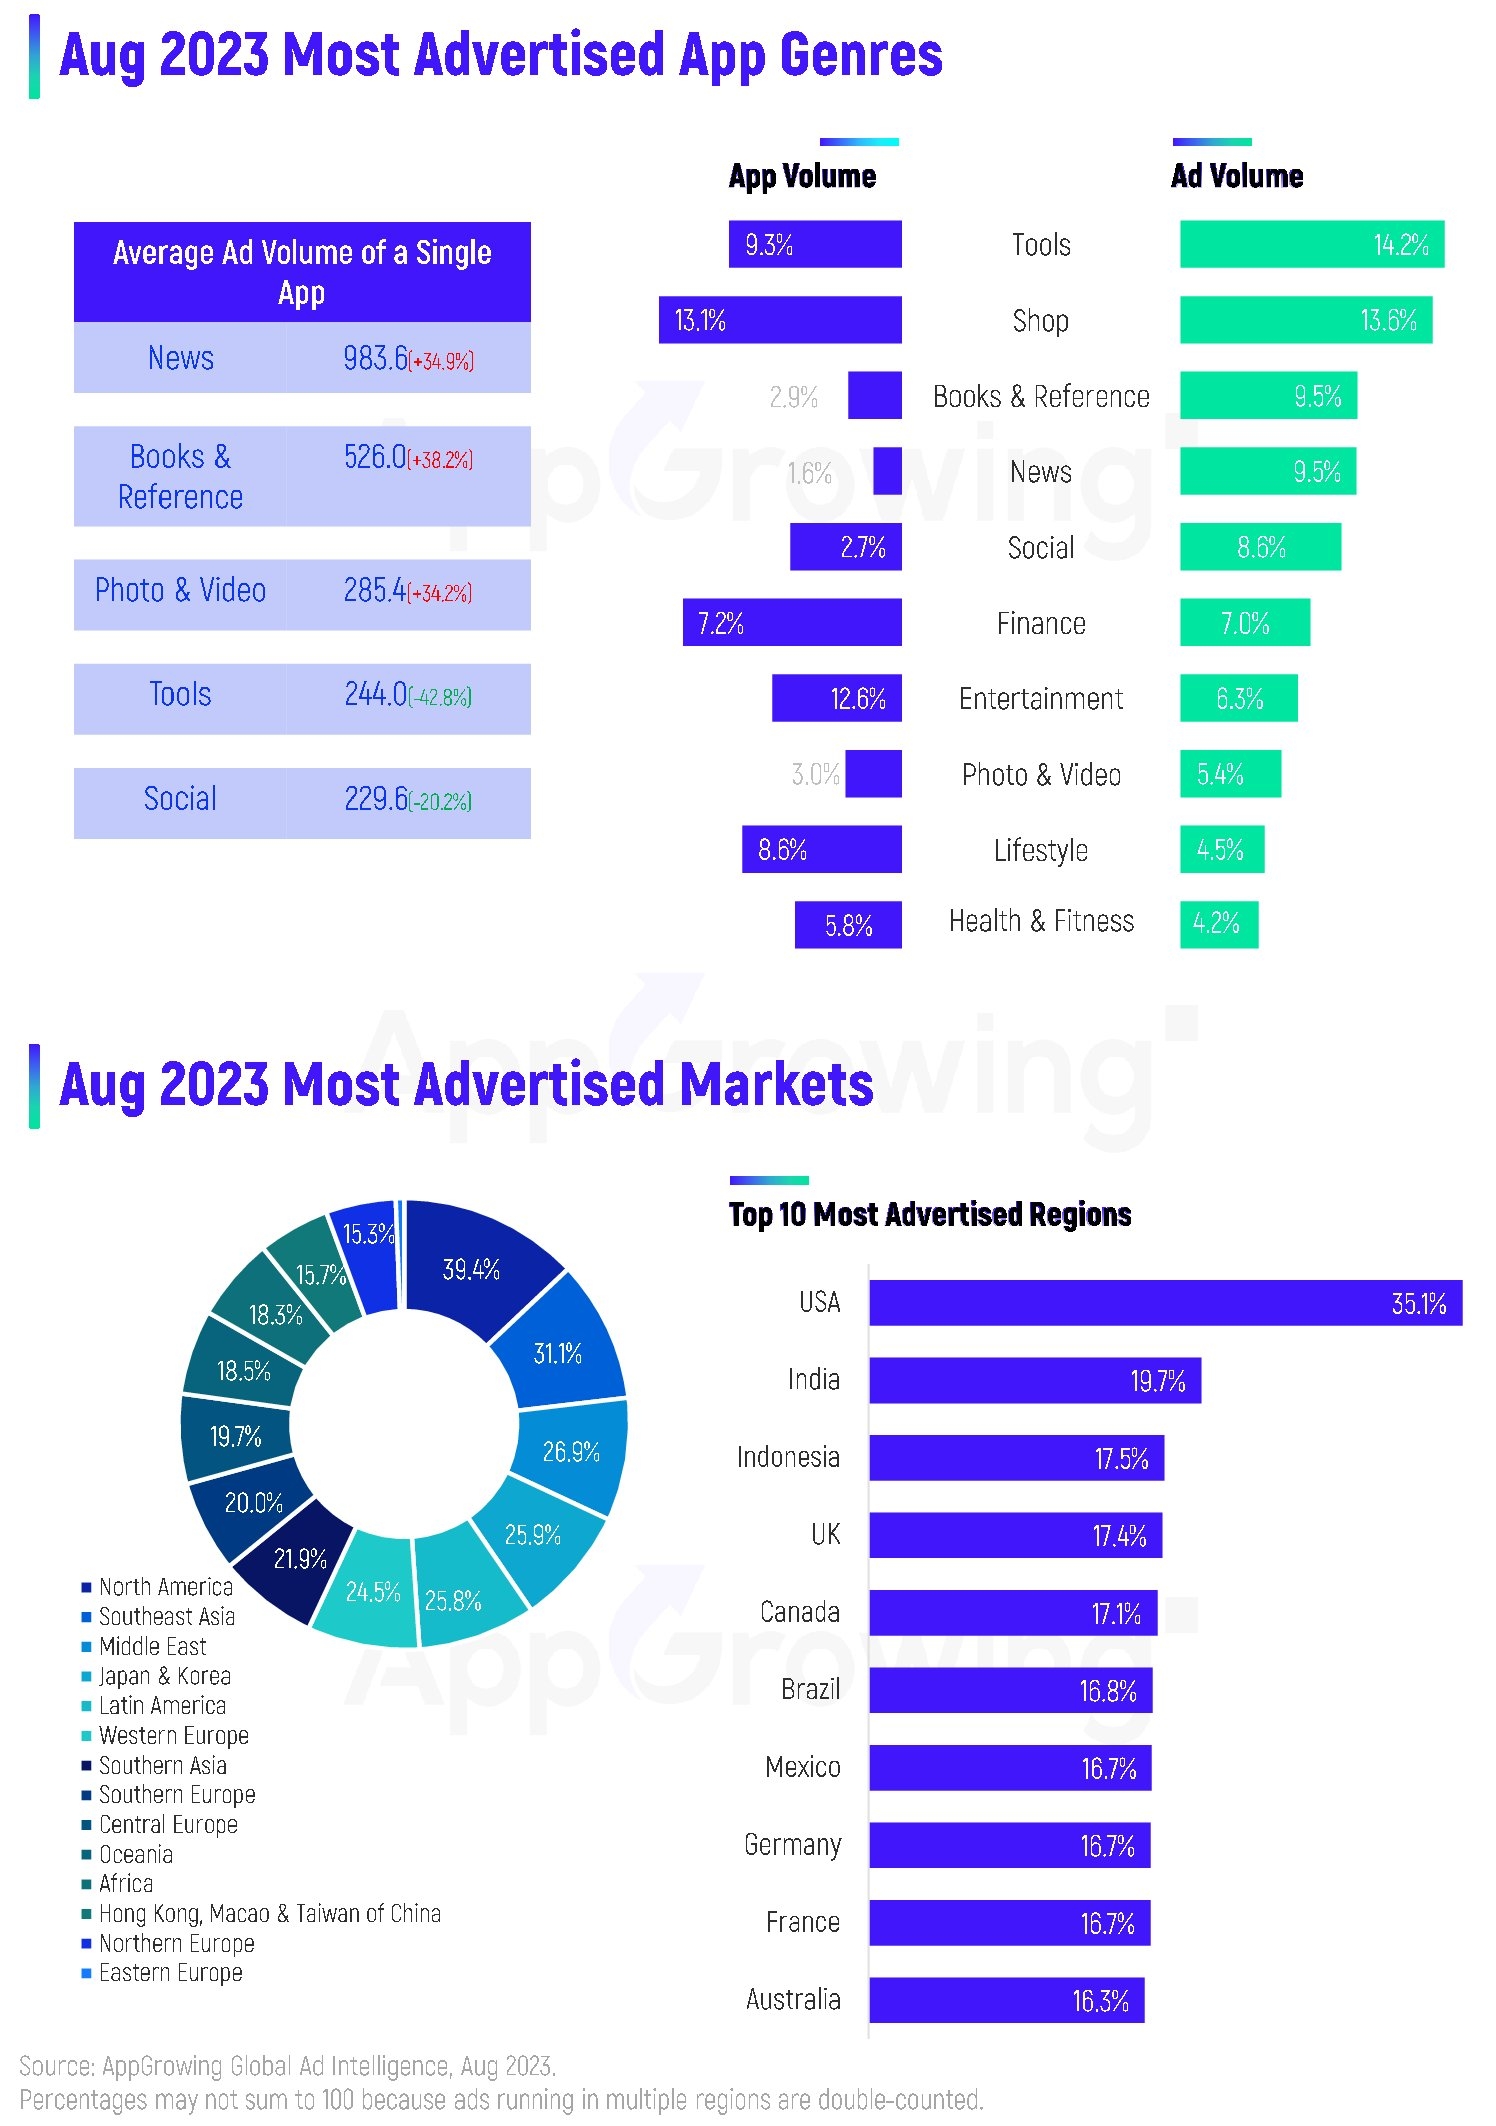
In terms of genre, Tools still accounted for most of Ad Volume in August, but decreased to 14.2%. Shop and Books & Reference followed with 13.6% and 9.5% respectively. Shop accounted for the largest share of App Volume, at 13.1%. Tools, Lifestyle and Finance followed.
For the average Ad Volume for a single app, News held at No. 1, with a 34.9% MoM jump. It was followed by Books & Reference, Photo & Video, Tools, and Social. The former 3 all grew by more than 30% MoM.
By region, the Top 3 regions in Ad Volume are North America, Southeast Asia and the Middle East, accounting for 39.4%, 31.1% and 26.9% respectively. In addition, Japan & Korea, Latin America, Western Europe, South Asia and Southern Europe accounted for more than 20%.
The USA remained at the top of the TOP10 regions list, with a 35.1% share. India and Indonesia followed with 19.7% and 17.5% respectively.
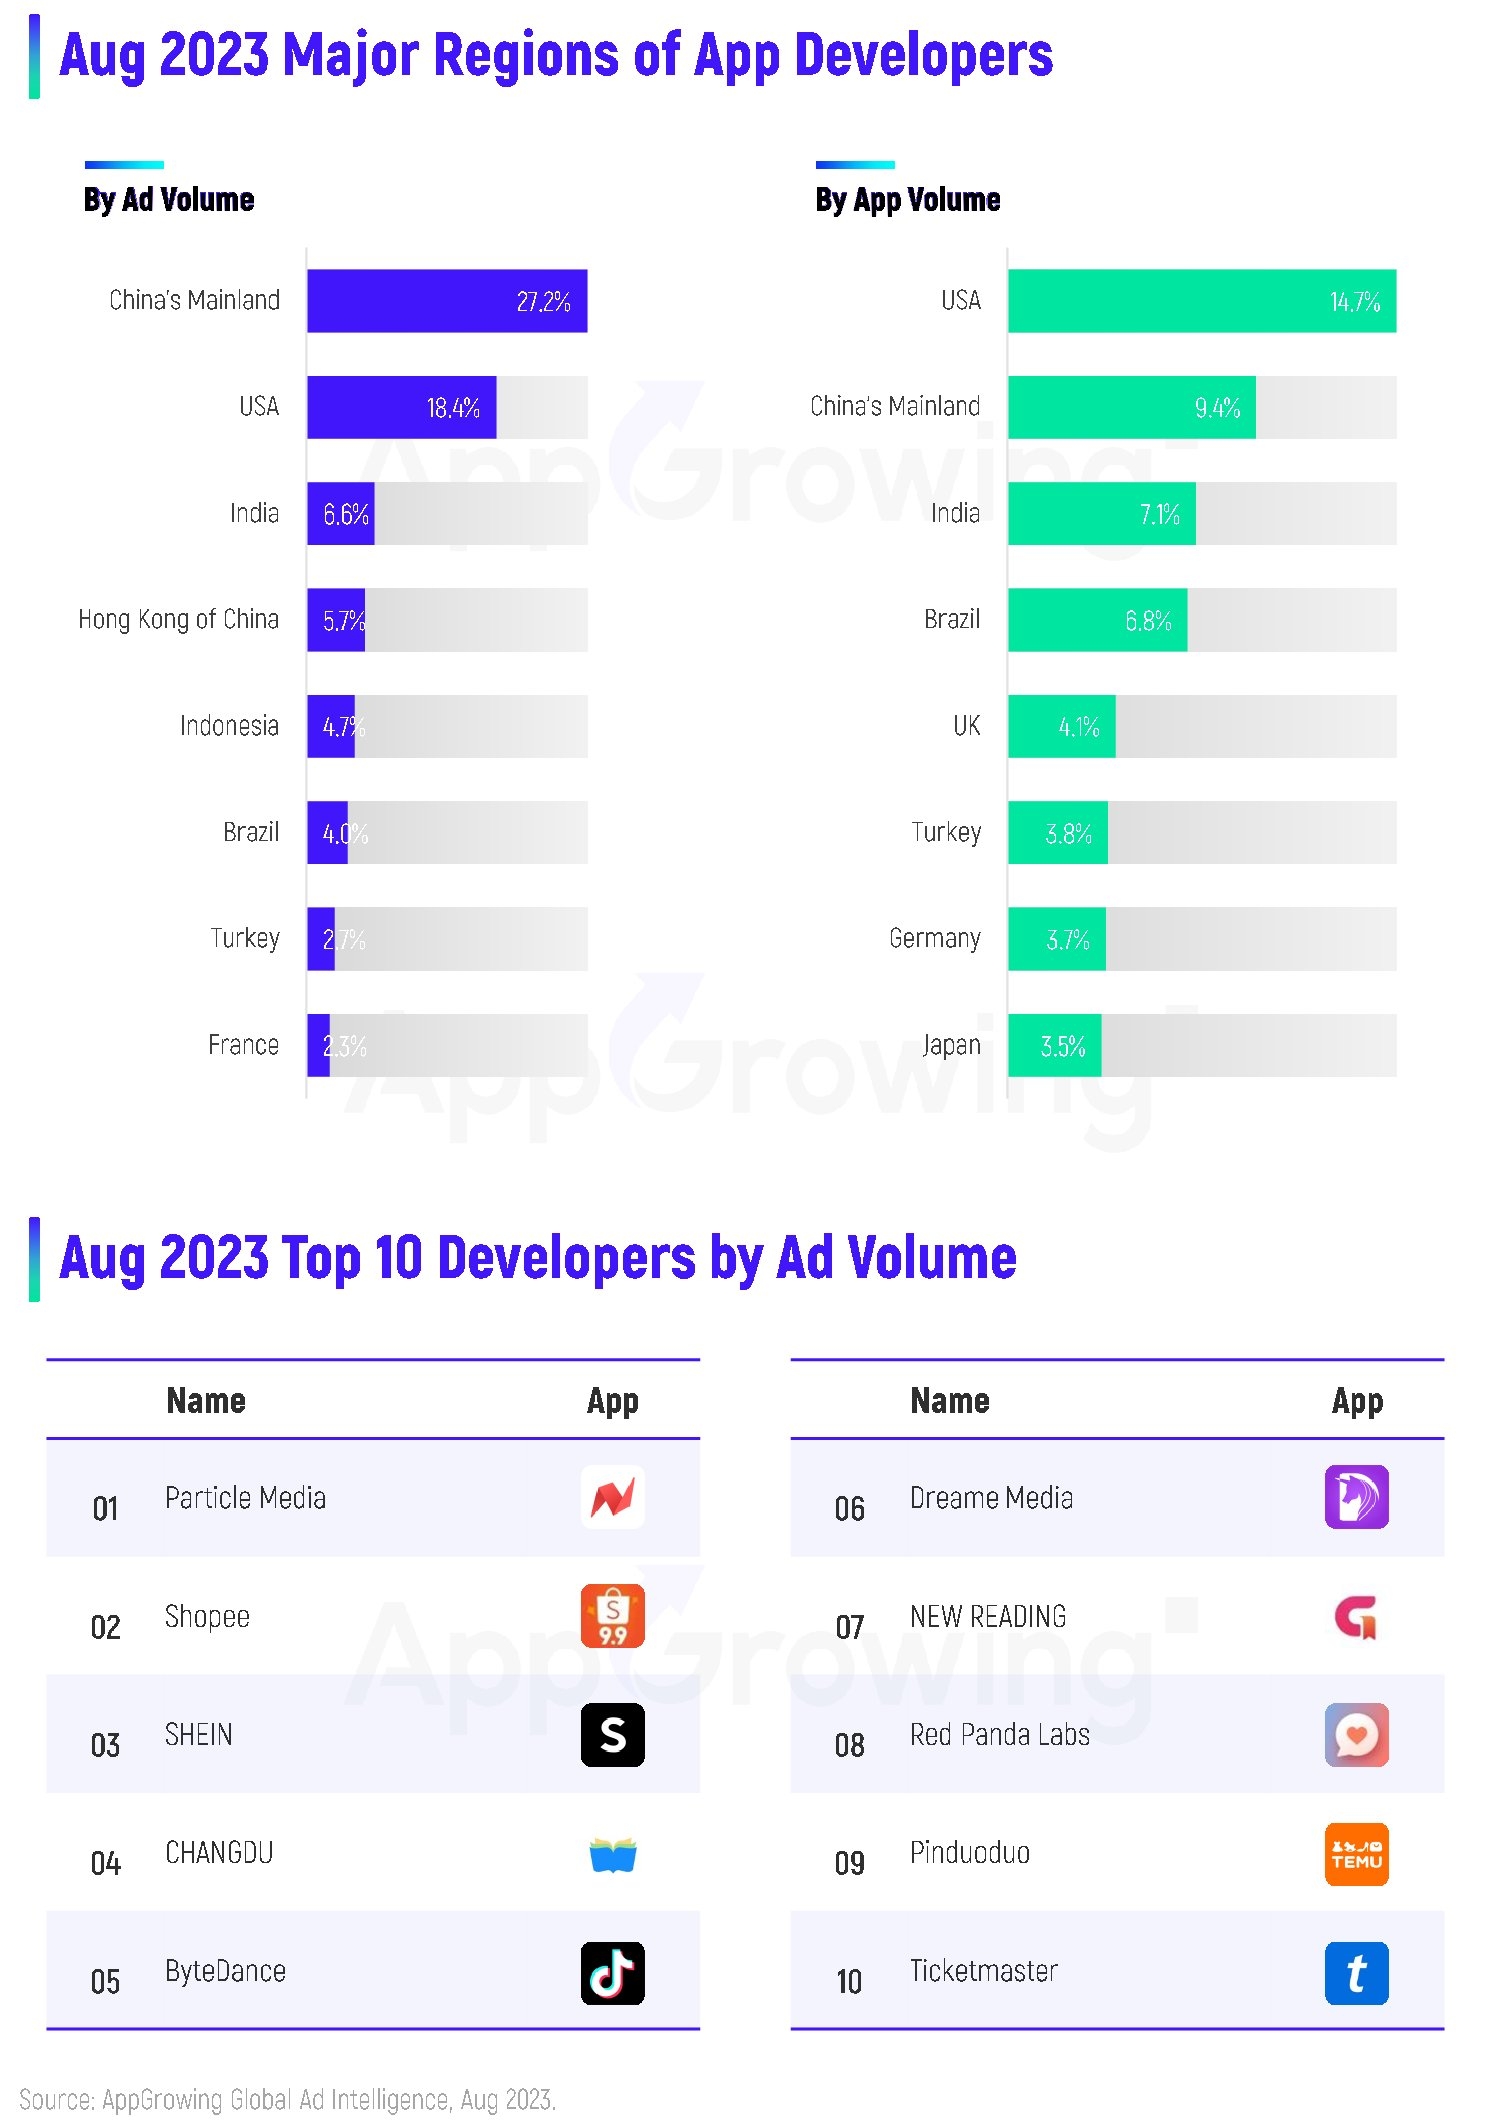
Looking at the sources of app developers, China's Mainland is still the largest advertiser in August, while the USA is the TOP 1 in App Volume.
Among the Top 10 App Developers, the Top 3 were Paticle Media, Shopee and SHEIN. 6 Developers from China made the list, with their products mainly in the Shop, Books & Reference and Social categories.
02 Most Advertised Apps
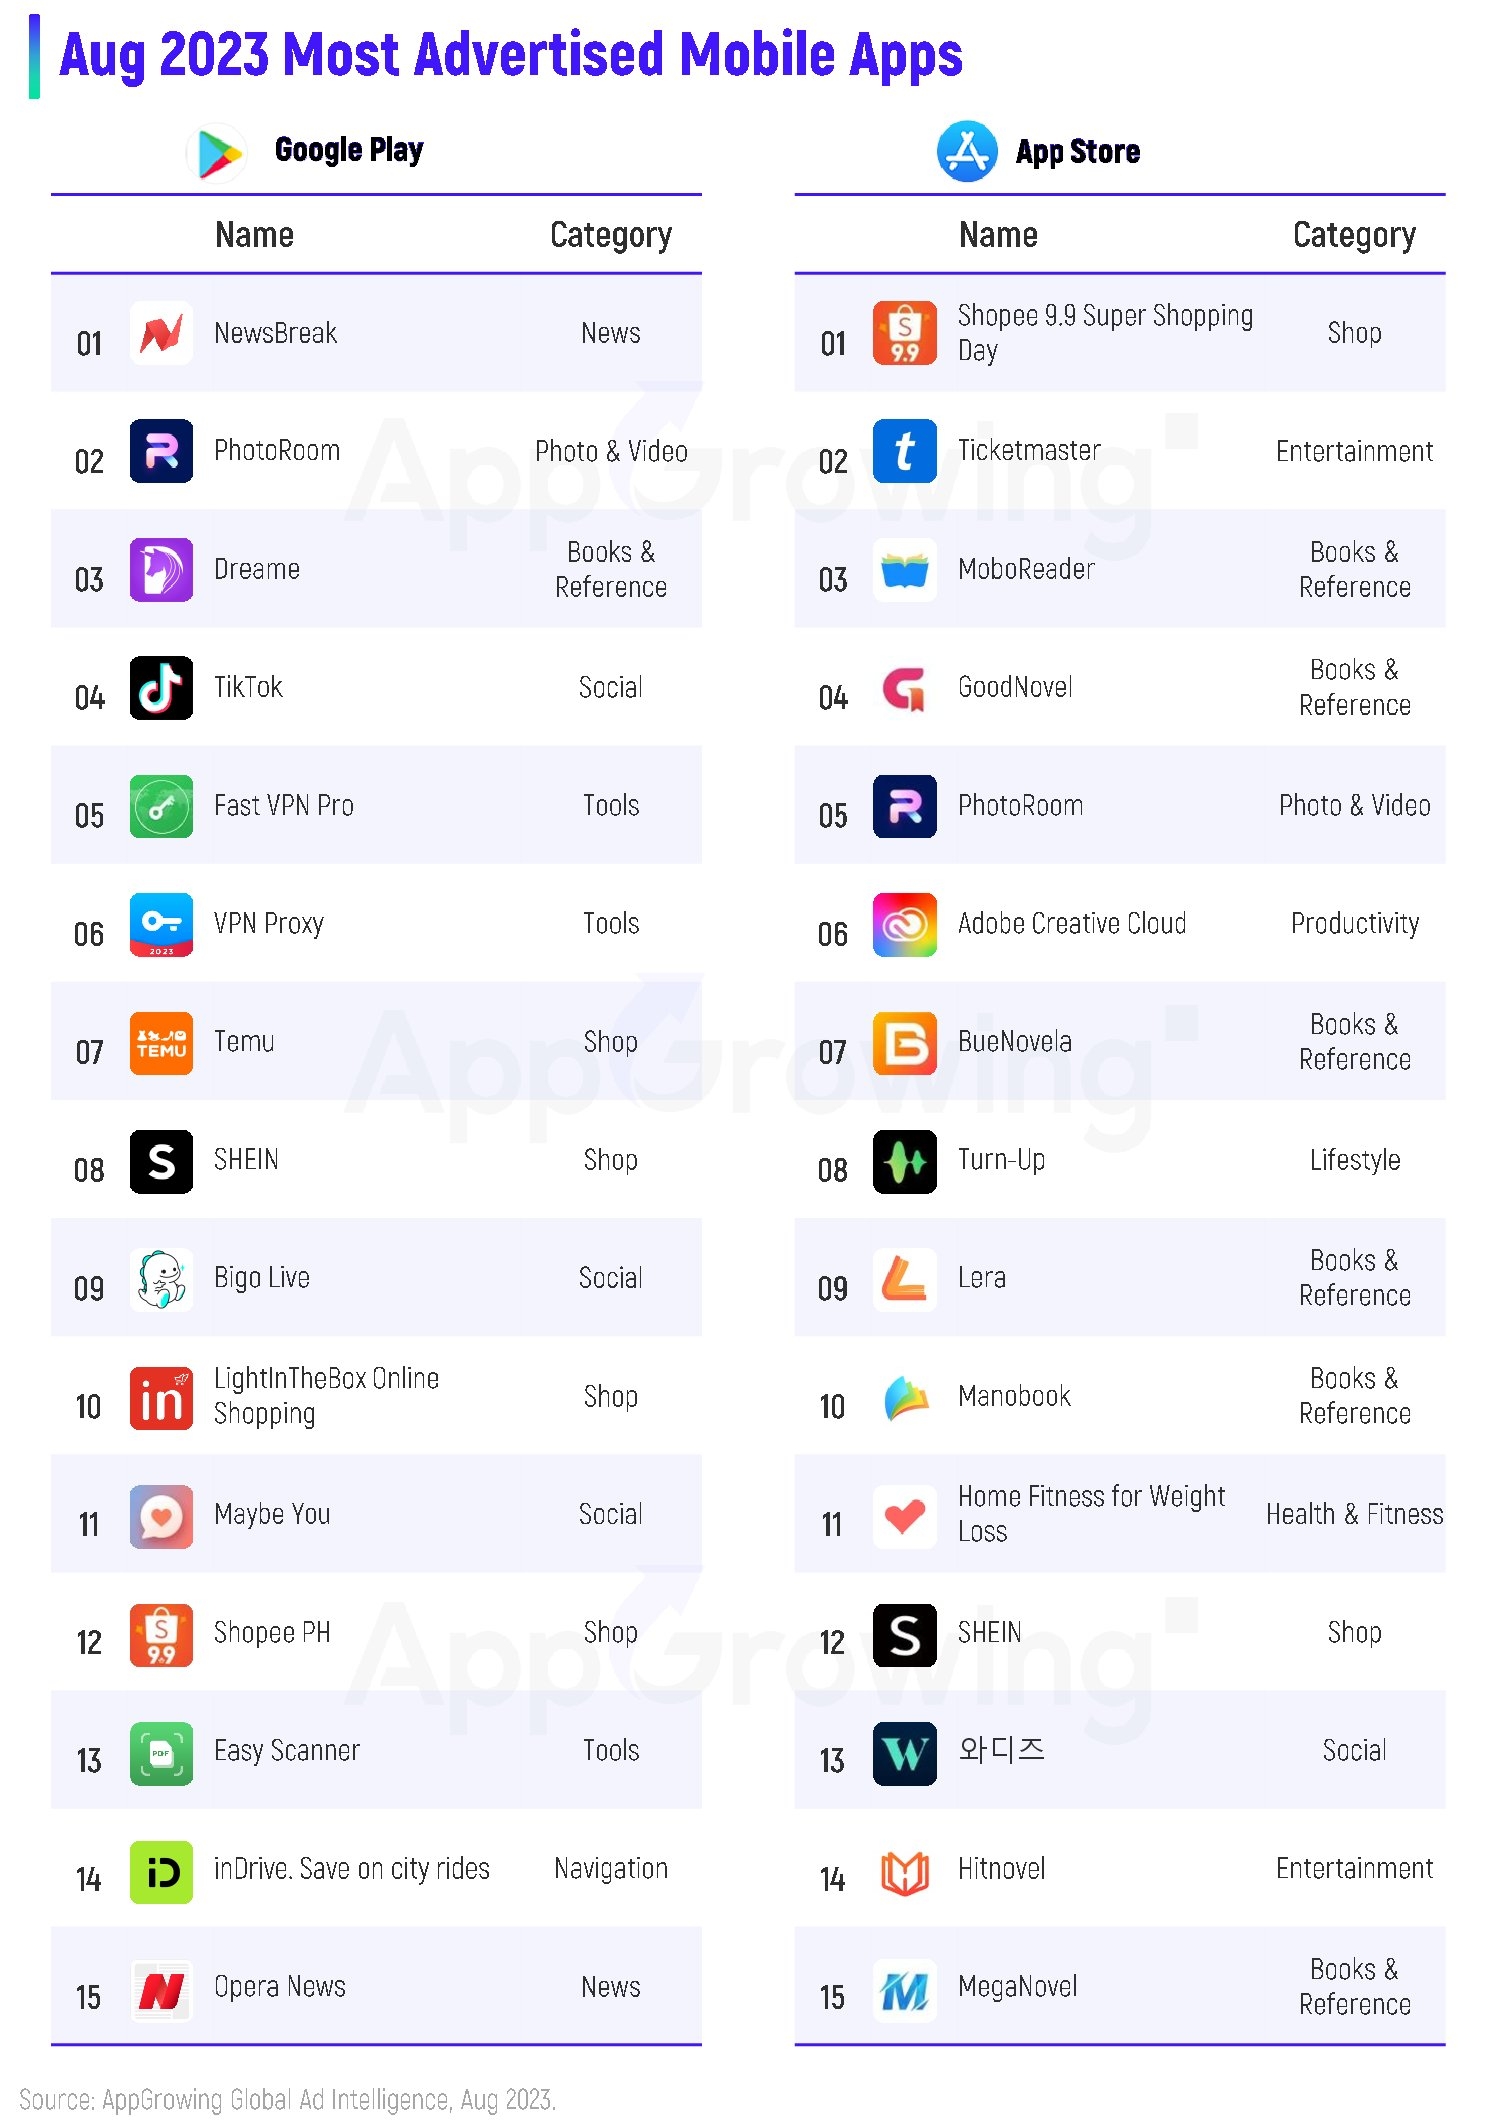
The Most Advertised Apps on Google Play were mostly in the Shop category, with four. Previously top-ranked SHEIN slipped to No. 8, with its competitor Temu at No. 7. NewsBreak held steady at No. 1, and PhotoRoom in the Photo & Video category jumped to No. 2 with a surge in Ad Volume.
On the App Store, the most charted category continues to be Books & Reference, with as many as 6 titles.
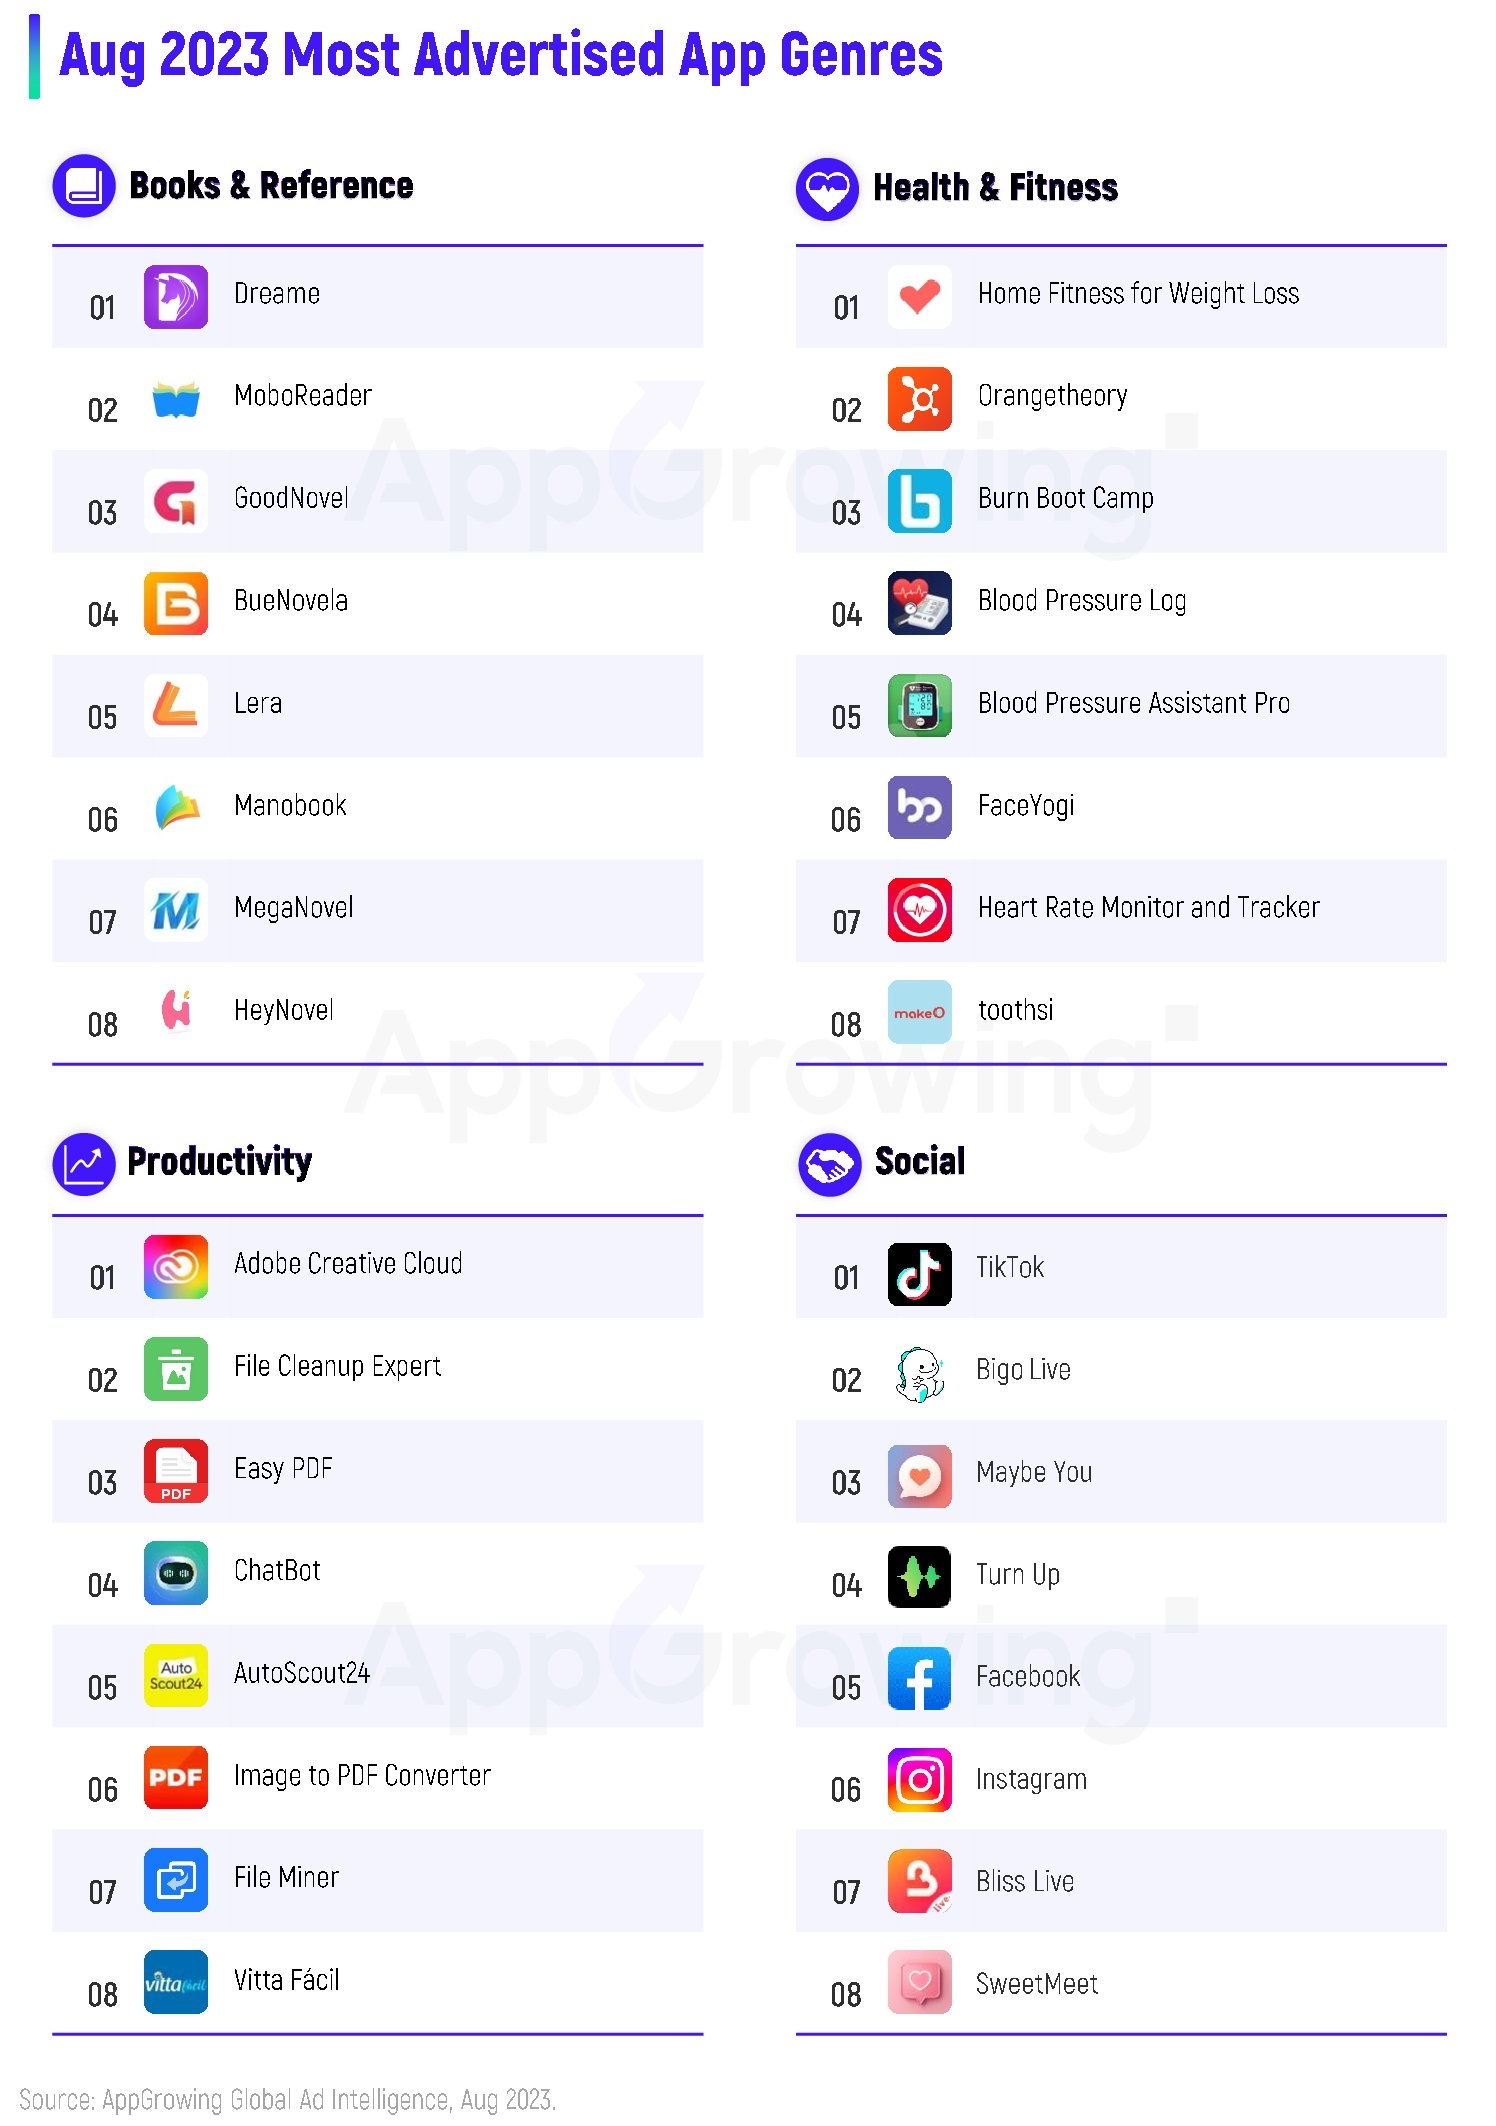
AppGrowing chose four key categories to rank: Books & Reference, Health & Fitness, Productivity, and Social.
Dreame is the Top 1 in Books & Reference, with half of the positions taken by apps from Chinese developers. In Health & Fitness, the Top 1 in Ad Volume is Home Fitness for Weight Loss. Monitoring body data is the main feature of most products on the list. As for productivity, Adobe Creative Cloud took the first place. The Top 3 in the Social category remained the same as in July, with TikTok, Bigo Live and Maybe You.
03 Case Analysis
Case 1: Adobe Creative Cloud
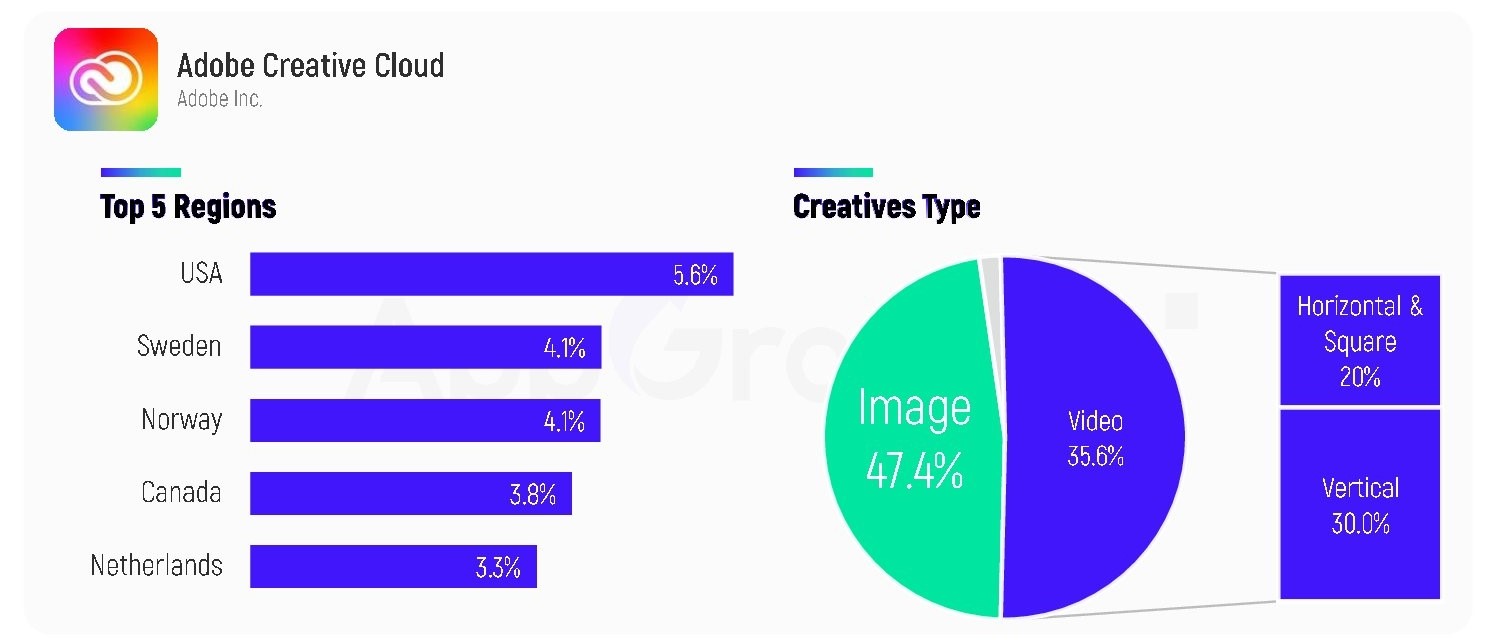
Adobe Creative Cloud is a cloud service app from Adobe. By subscription, users could use Photoshop, Illustrator, InDesign, ect. in the app. In August, it was mainly advertised in the European and American markets, such as the USA, Sweden, Norway, Canada, and Netherlands. For Creative type, images account for a larger proportion, and videos are more vertical.
As a tool aggregation app, the ad creative of Adobe Creative Cloud is simple, primarily highlighting the powerful functions of the product itself. Also, thanks to the influence of the Adobe brand, more attention is paid to the brand style in the content packaging.
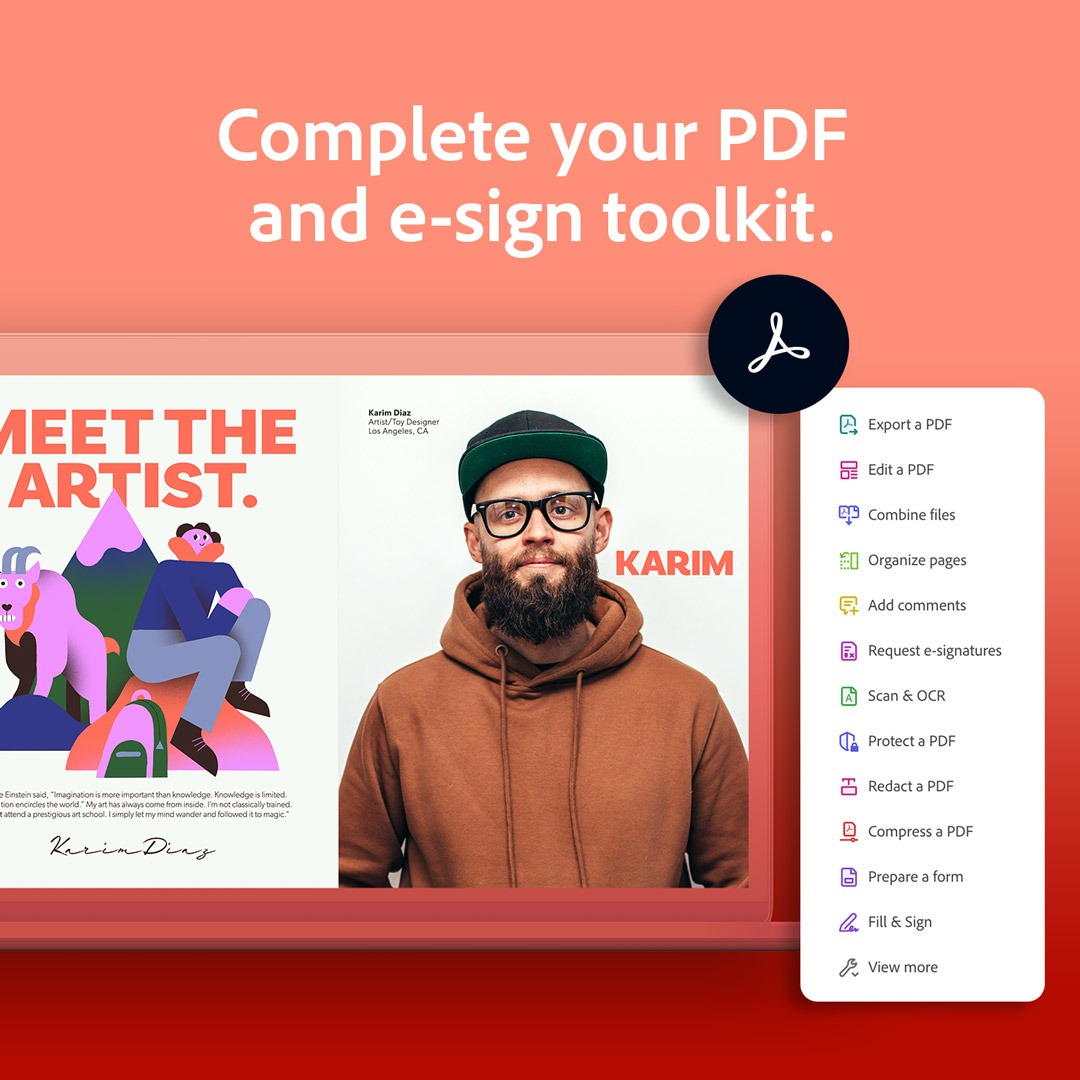
Specifically, the image creative format of Adobe Creative Cloud is rather fixed. It can be summarized as "feature list + live-action image". Taking the following one as an example, the brand's products are listed on the right side of the image, while a real picture in the middle attracts the user's attention. The text at the top complements the core functionality of the product.
Source: AppGrowing
Most of the videos featured live action to deliver a brand impact with life-like scenarios. The video below shows the user using the app and conveys the advantages such as powerful and complete features. At the end, the app icon and the download entrance are presented to deepen users' impression of the brand.
Case 2: inDrive
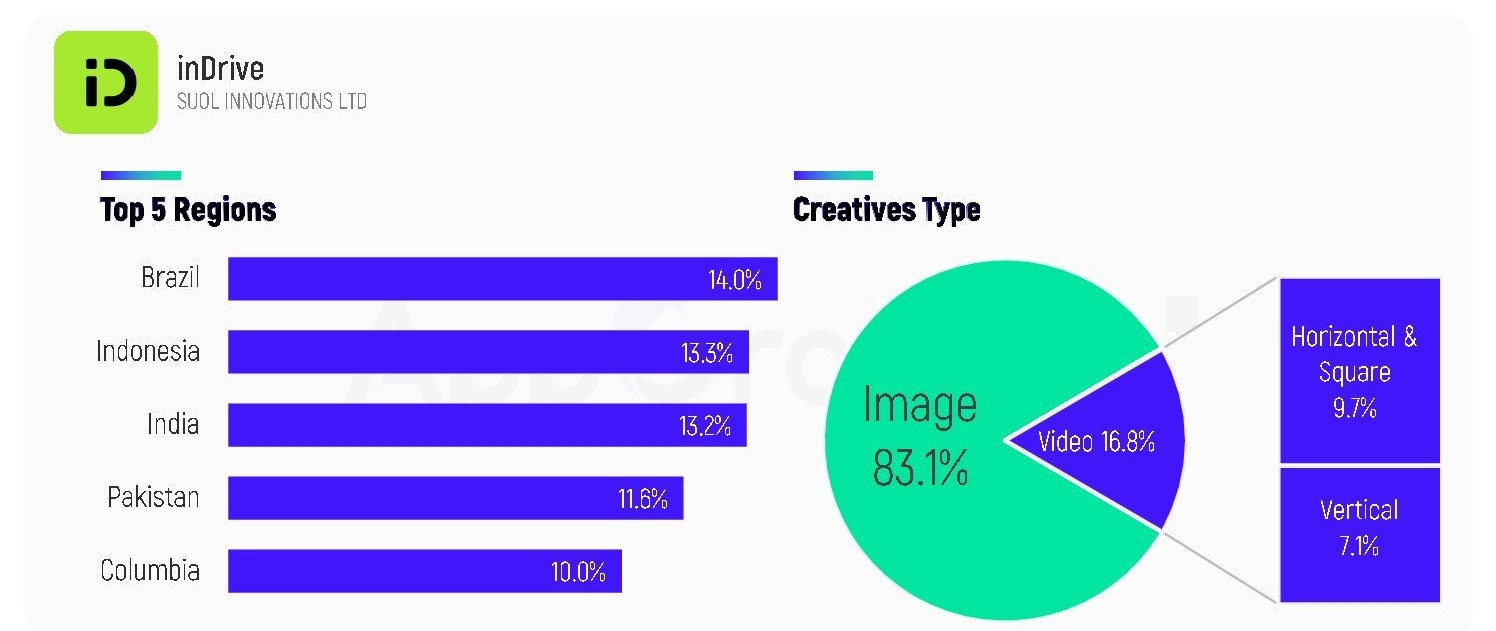
The one-stop travel platform inDrive has entered Latin America this year, according to public information. AppGrowing data shows that the app ran ad campaigns mainly in Brazil, Indonesia, India, Pakistan, and Colombia in August. The creative type is dominated by image, while horizontal and square videos outnumber vertical ones.
In terms of creative, the ads of inDrive mostly use live action to promote the brand image of reliability and trustworthiness. In addition, contents created with emoji elements favored by young overseas users are also in its ad list.
For example, the image ad is targeted at the driver group. A photo of the driver and passenger is shown at the upper part to quickly inform users of the ad content. Below that, the text "Full of travel demand on weekends" suggests that there are plenty of demands on the app so that great money can be earned.
Source: AppGrowing
The following video uses emoji+simple animation to visualize the process of “passengers and drivers making an order”. The emoji elements add fun to the video, which greatly fit with social media.
