Here is AppGrowing's analysis of the global mobile App advertising markets in November 2023, based on advertising data from 25 global media platforms in 50 countries/regions.
01 Advertising Trends
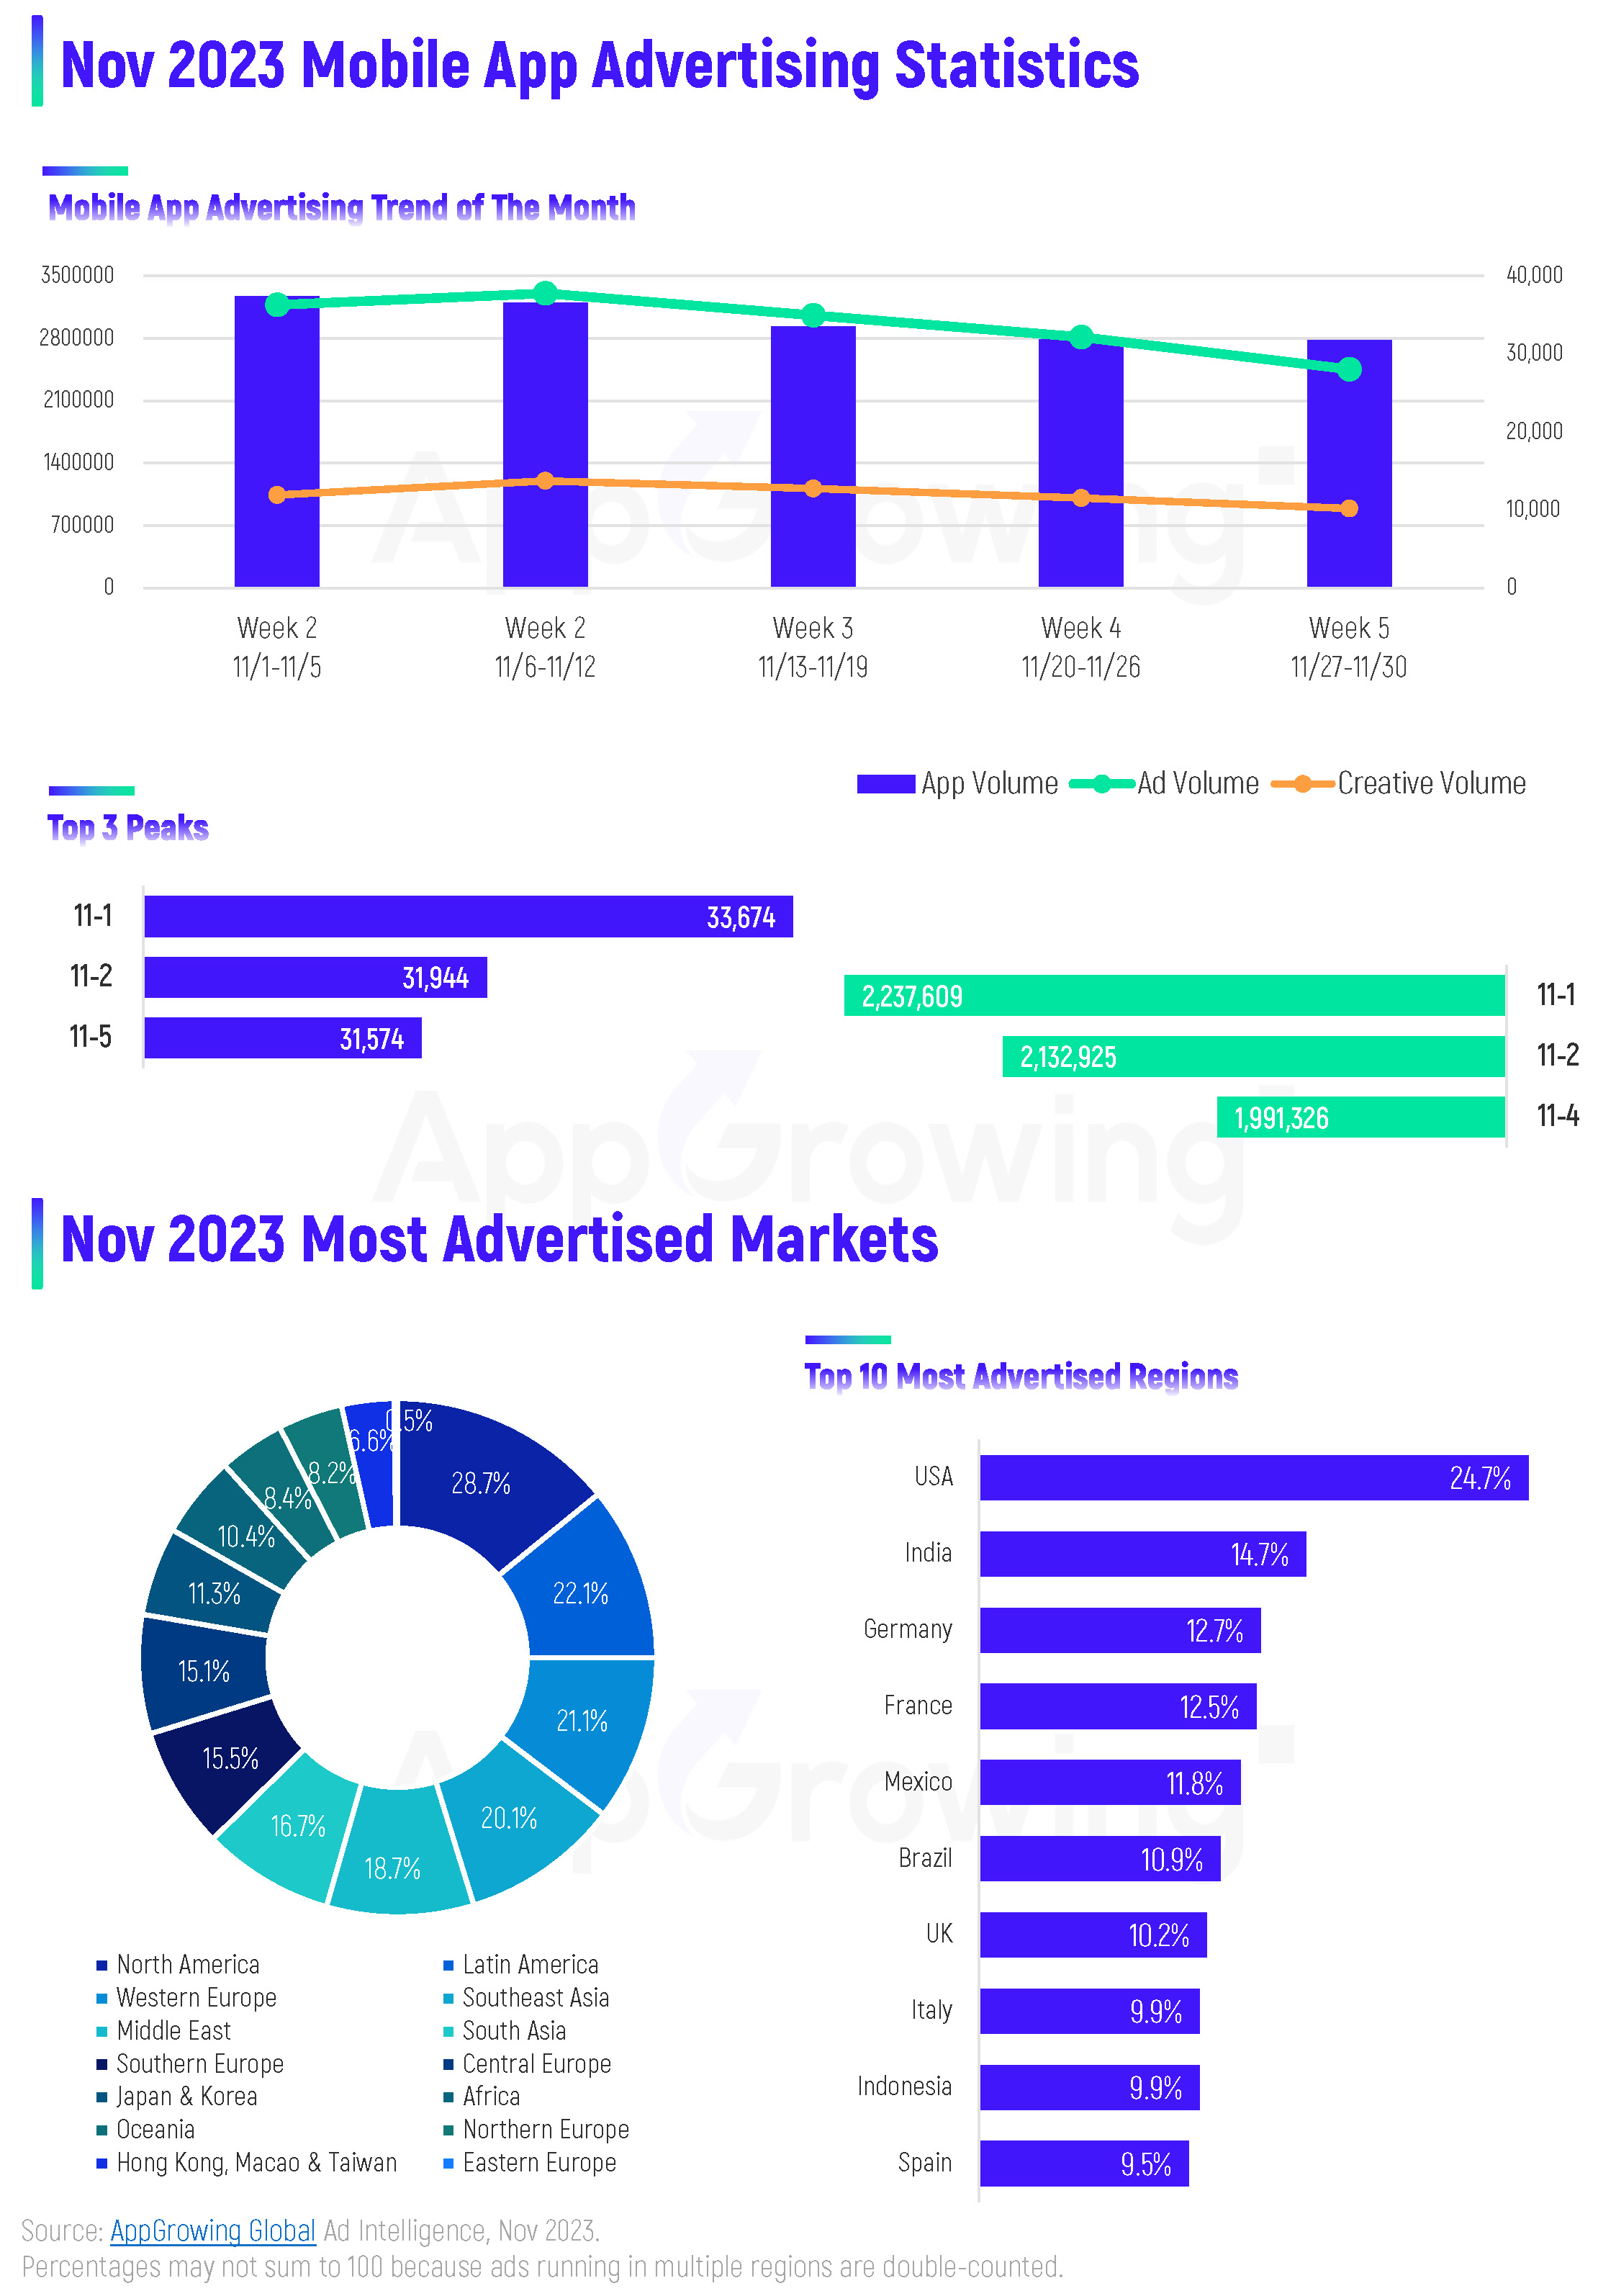
Global App Ad Volume and App Volume remain high scale in November. For the first 3 weeks, ad volume was at 3M+ and App volume stayed above 30K. Creative volume was steady, at 700K+ per week. On a single day, consistent with mobile game's, the peaks of App Ad Volume and App Volume both appeared in the early days of the month, with November 1st being No. 1 for both, at 2.23M+ and 33,674, respectively.
By region, the Top 3 in terms of Ad Volume are North America, Latin America, and Western Europe, with Southeast Asia in 4th place also accounting for more than 20% of the total. Specifically, the Top 5 are the USA, India, Germany, France and Mexico, with Brazil and the UK accounting for more than 10% of the total.
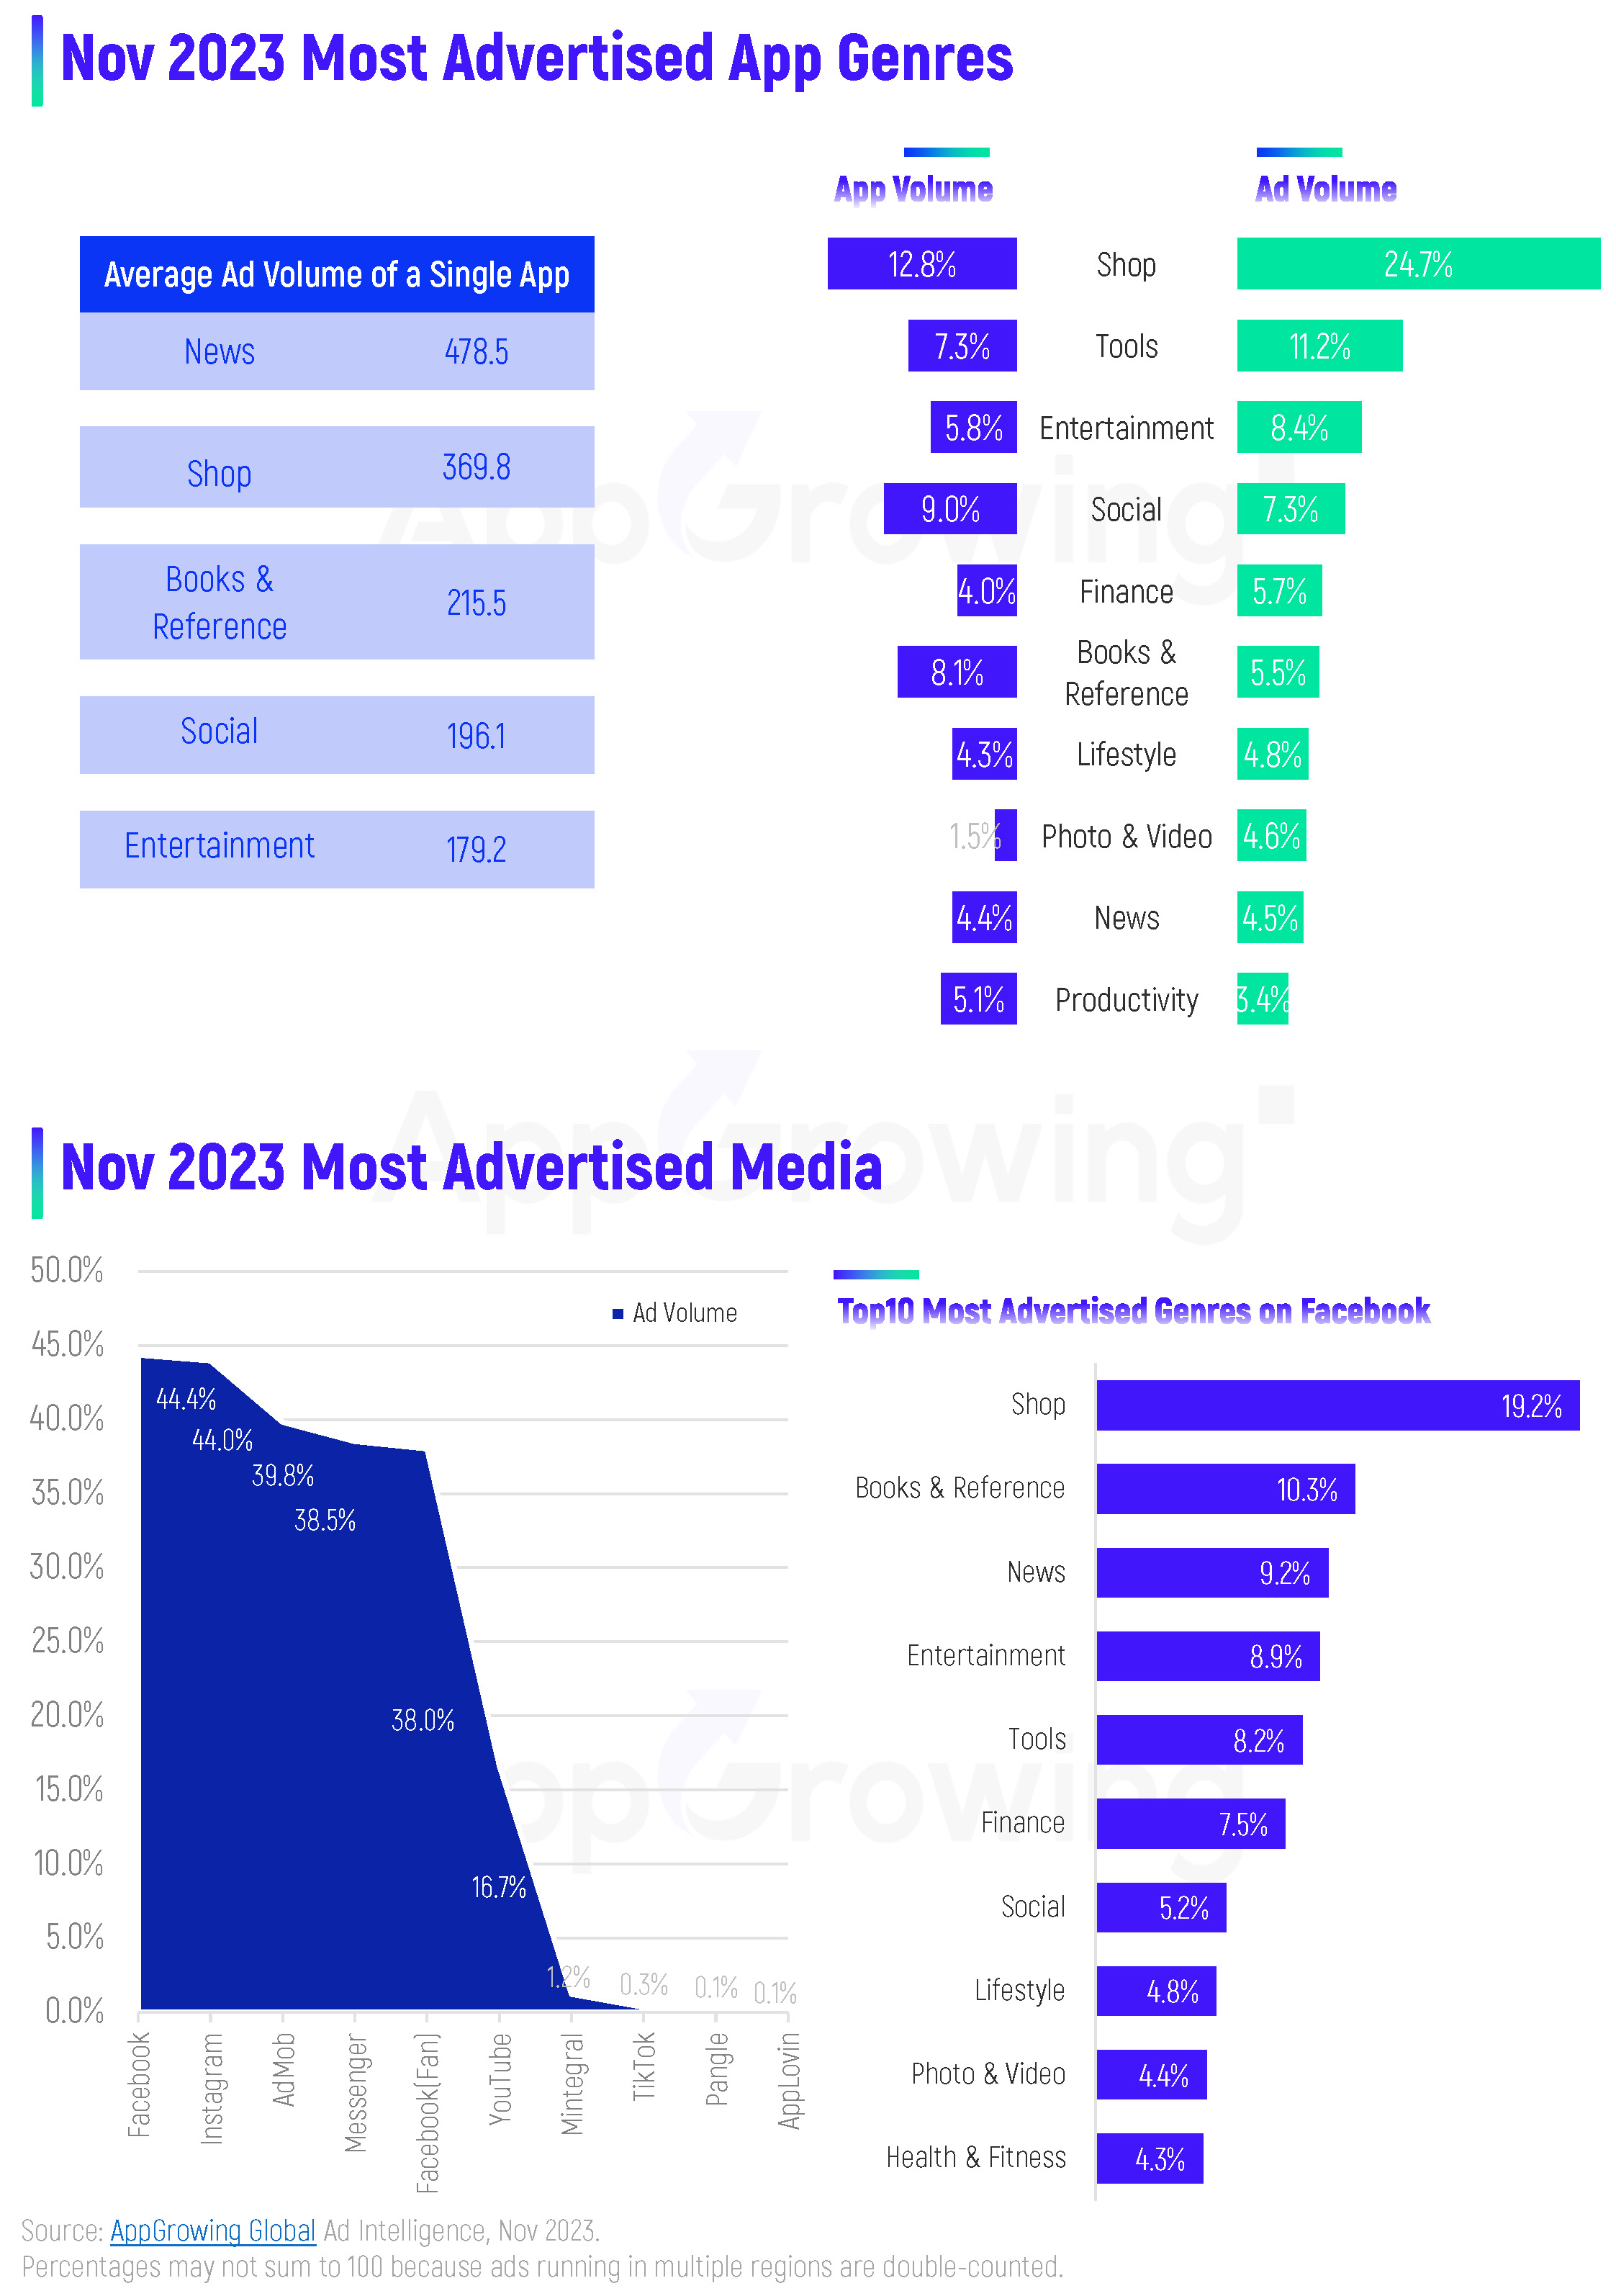
Category-wise, under the influence of shopping festivals such as "Double 11" and "Black Friday", Shop App volume kept growing, holding the No. 1 spot while increasing its share to 24.7%. At the same time, it also ranked first with a 12.8% share of App Volume. With the explosion of short dramas worldwide, Entertainment App ushered in a new marketing boom, ranking third with an 8.4% share of Ad Volume in November.
The TOP 3 categories by App Volume are Shop, Social, and Books & Reference, with large overall advertising scale in pan-entertainment related fields. In terms of the average Ad Volume for a single App, News still ranked first, but dropped to 478.5, followed by Shop, Books & Reference, Social, and Entertainment.
Let's look at media. According to AppGrowing, Facebook, Instagram, AdMob, Messenger, and Meta Audience Network are the Top 5 media in terms of App Ad Volume. AdMob accounts for nearly 40% of total, moving up to 3rd place compared to October. Specifically for Facebook, Shop, Books & Reference, News, Entertainment, and Tools are the main categories, with Shop accounting for 19.2% of the Ad Volume.
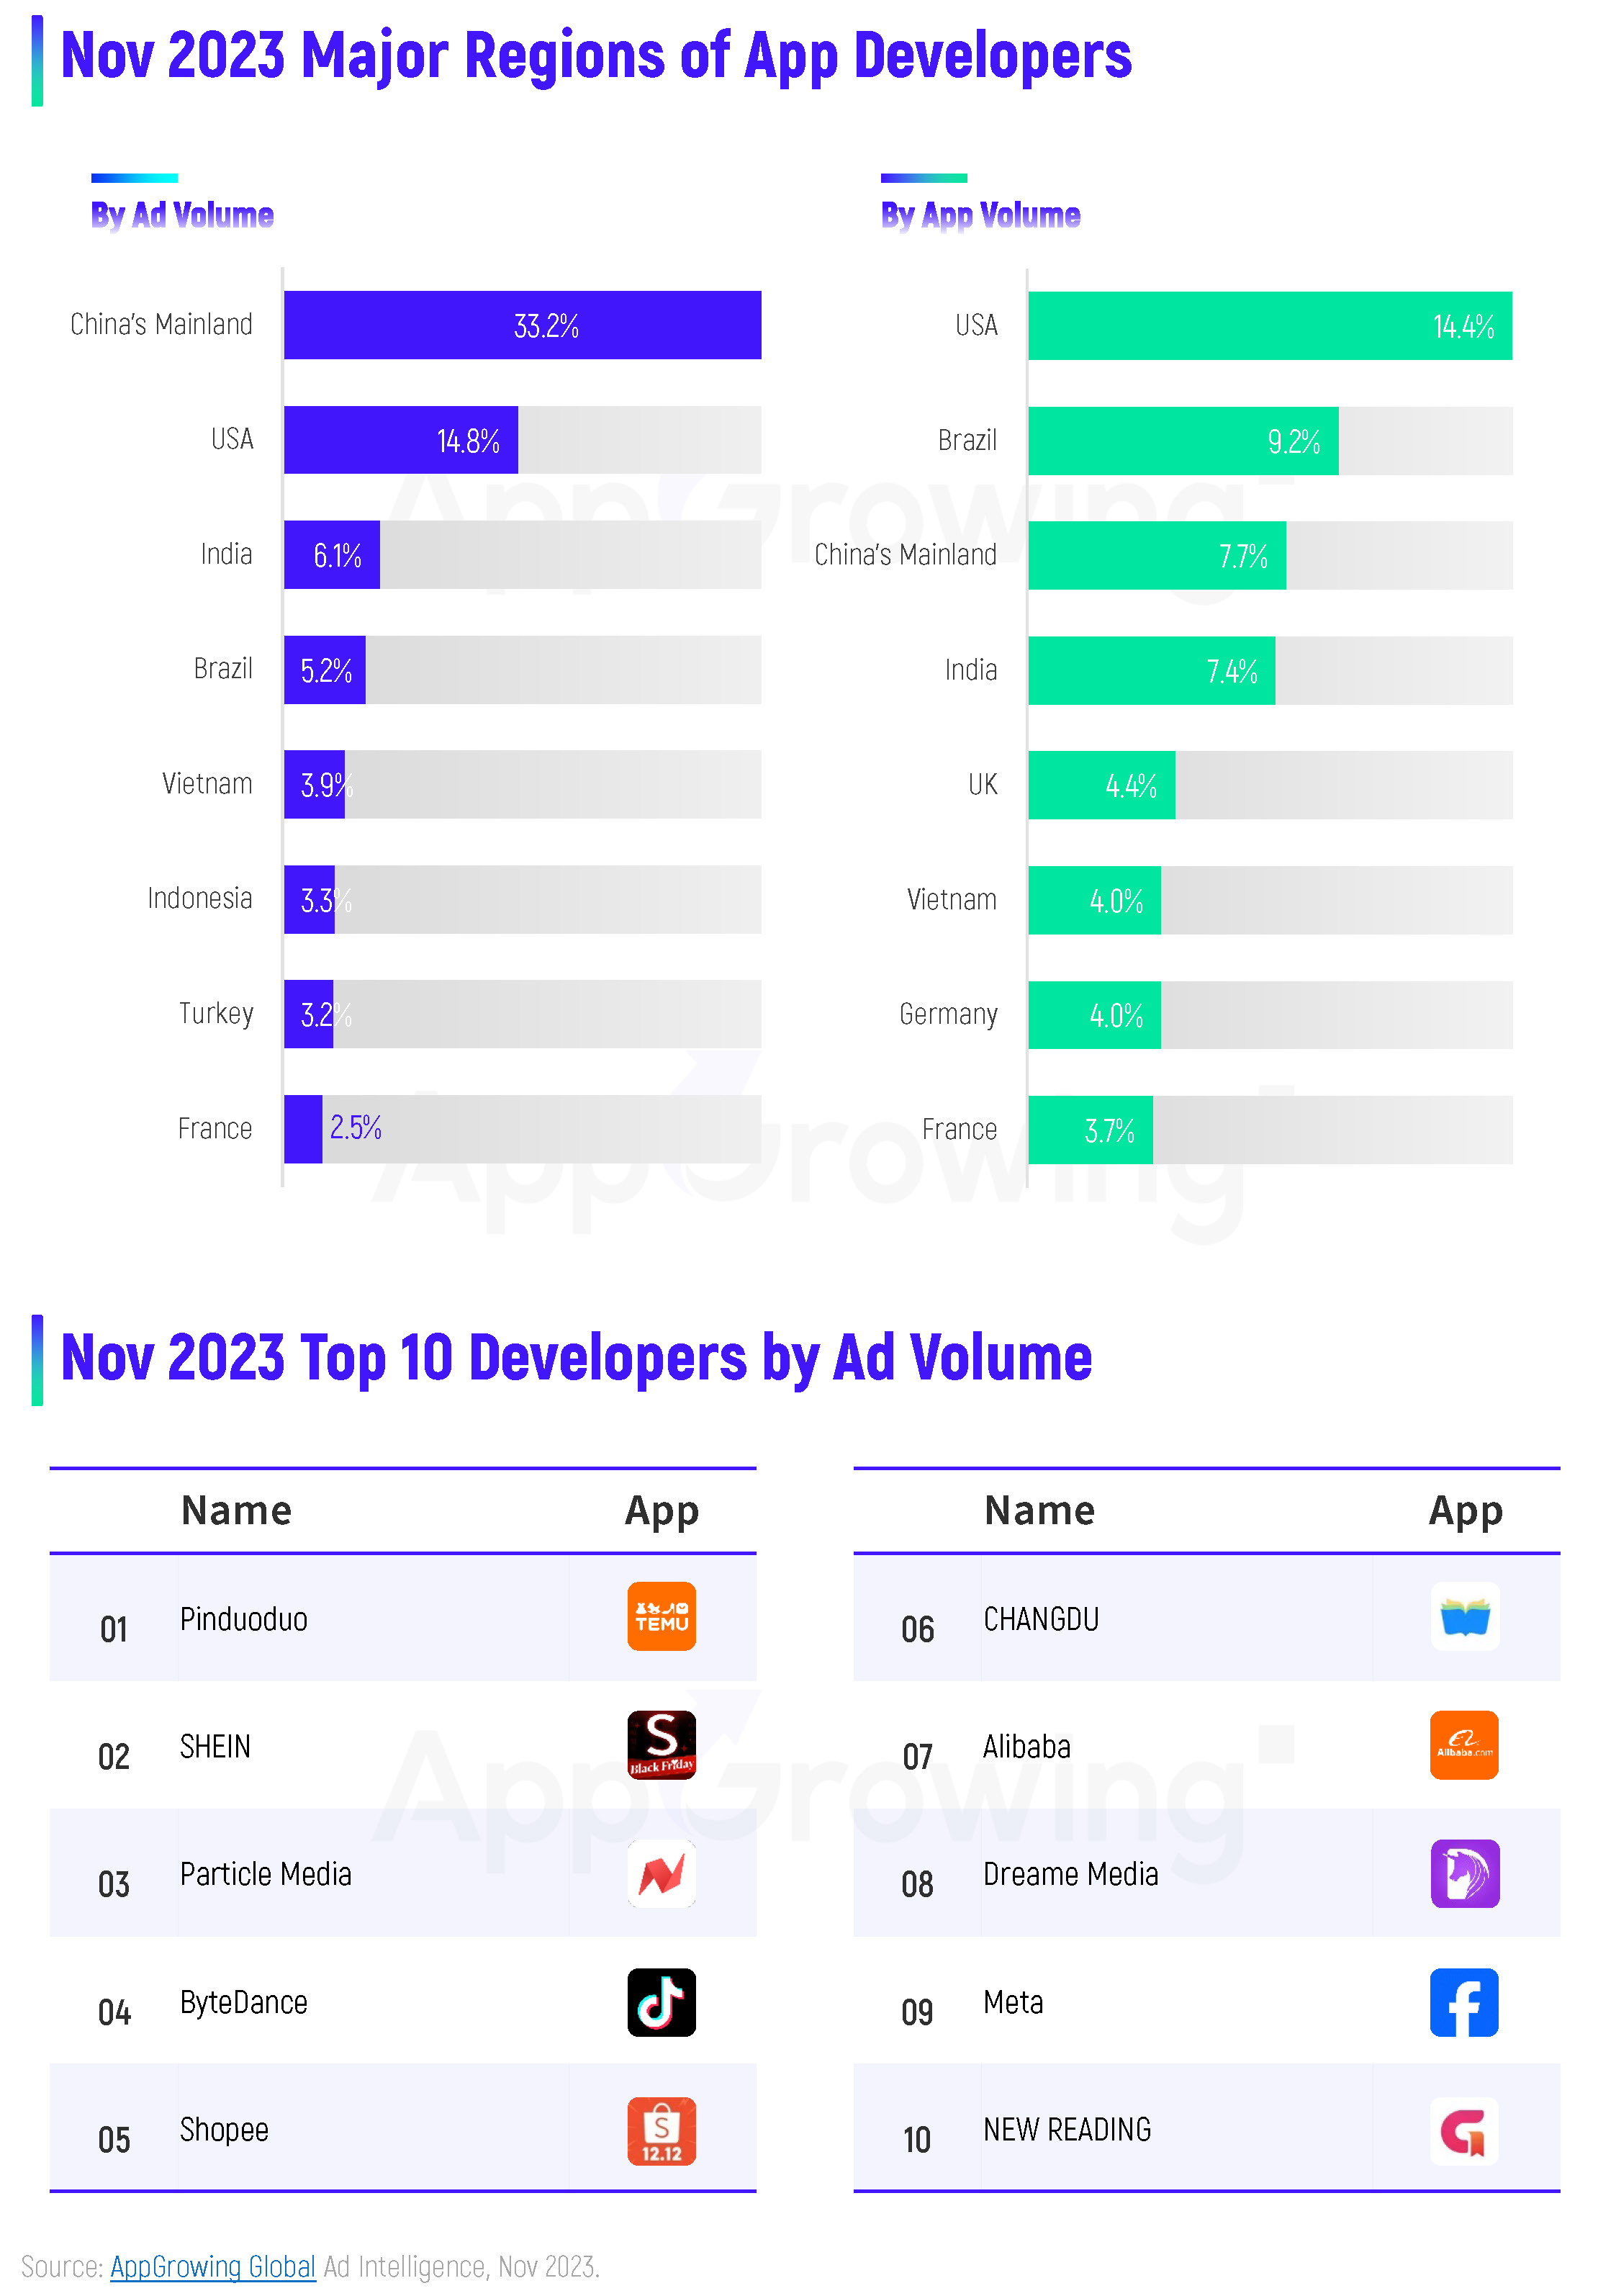
In terms of app developer regions, the Top 1 in terms of Ad Volume in November was still China's Mainland, increasing to 33.7%. The Top 1 in terms of App Volume was the USA. It is worth noting that Indian and Brazilian developers continued their growth momentum in October, remaining in the Top 5 on both lists.
In November's Most Advertised Developers, Pinduoduo overtook SHEIN to take the No. 1 spot, with Paticle Media still in 3rd place, and Shopee and Alibaba, both of which also specialize in shop apps, taking the 5th and 7th spots, respectively. In addition, other publishers from China's Mainland that made it to the Top 10 include ByteDance, CHANGDU, Dreame Media and NEW READING.
02 Most Advertised Apps
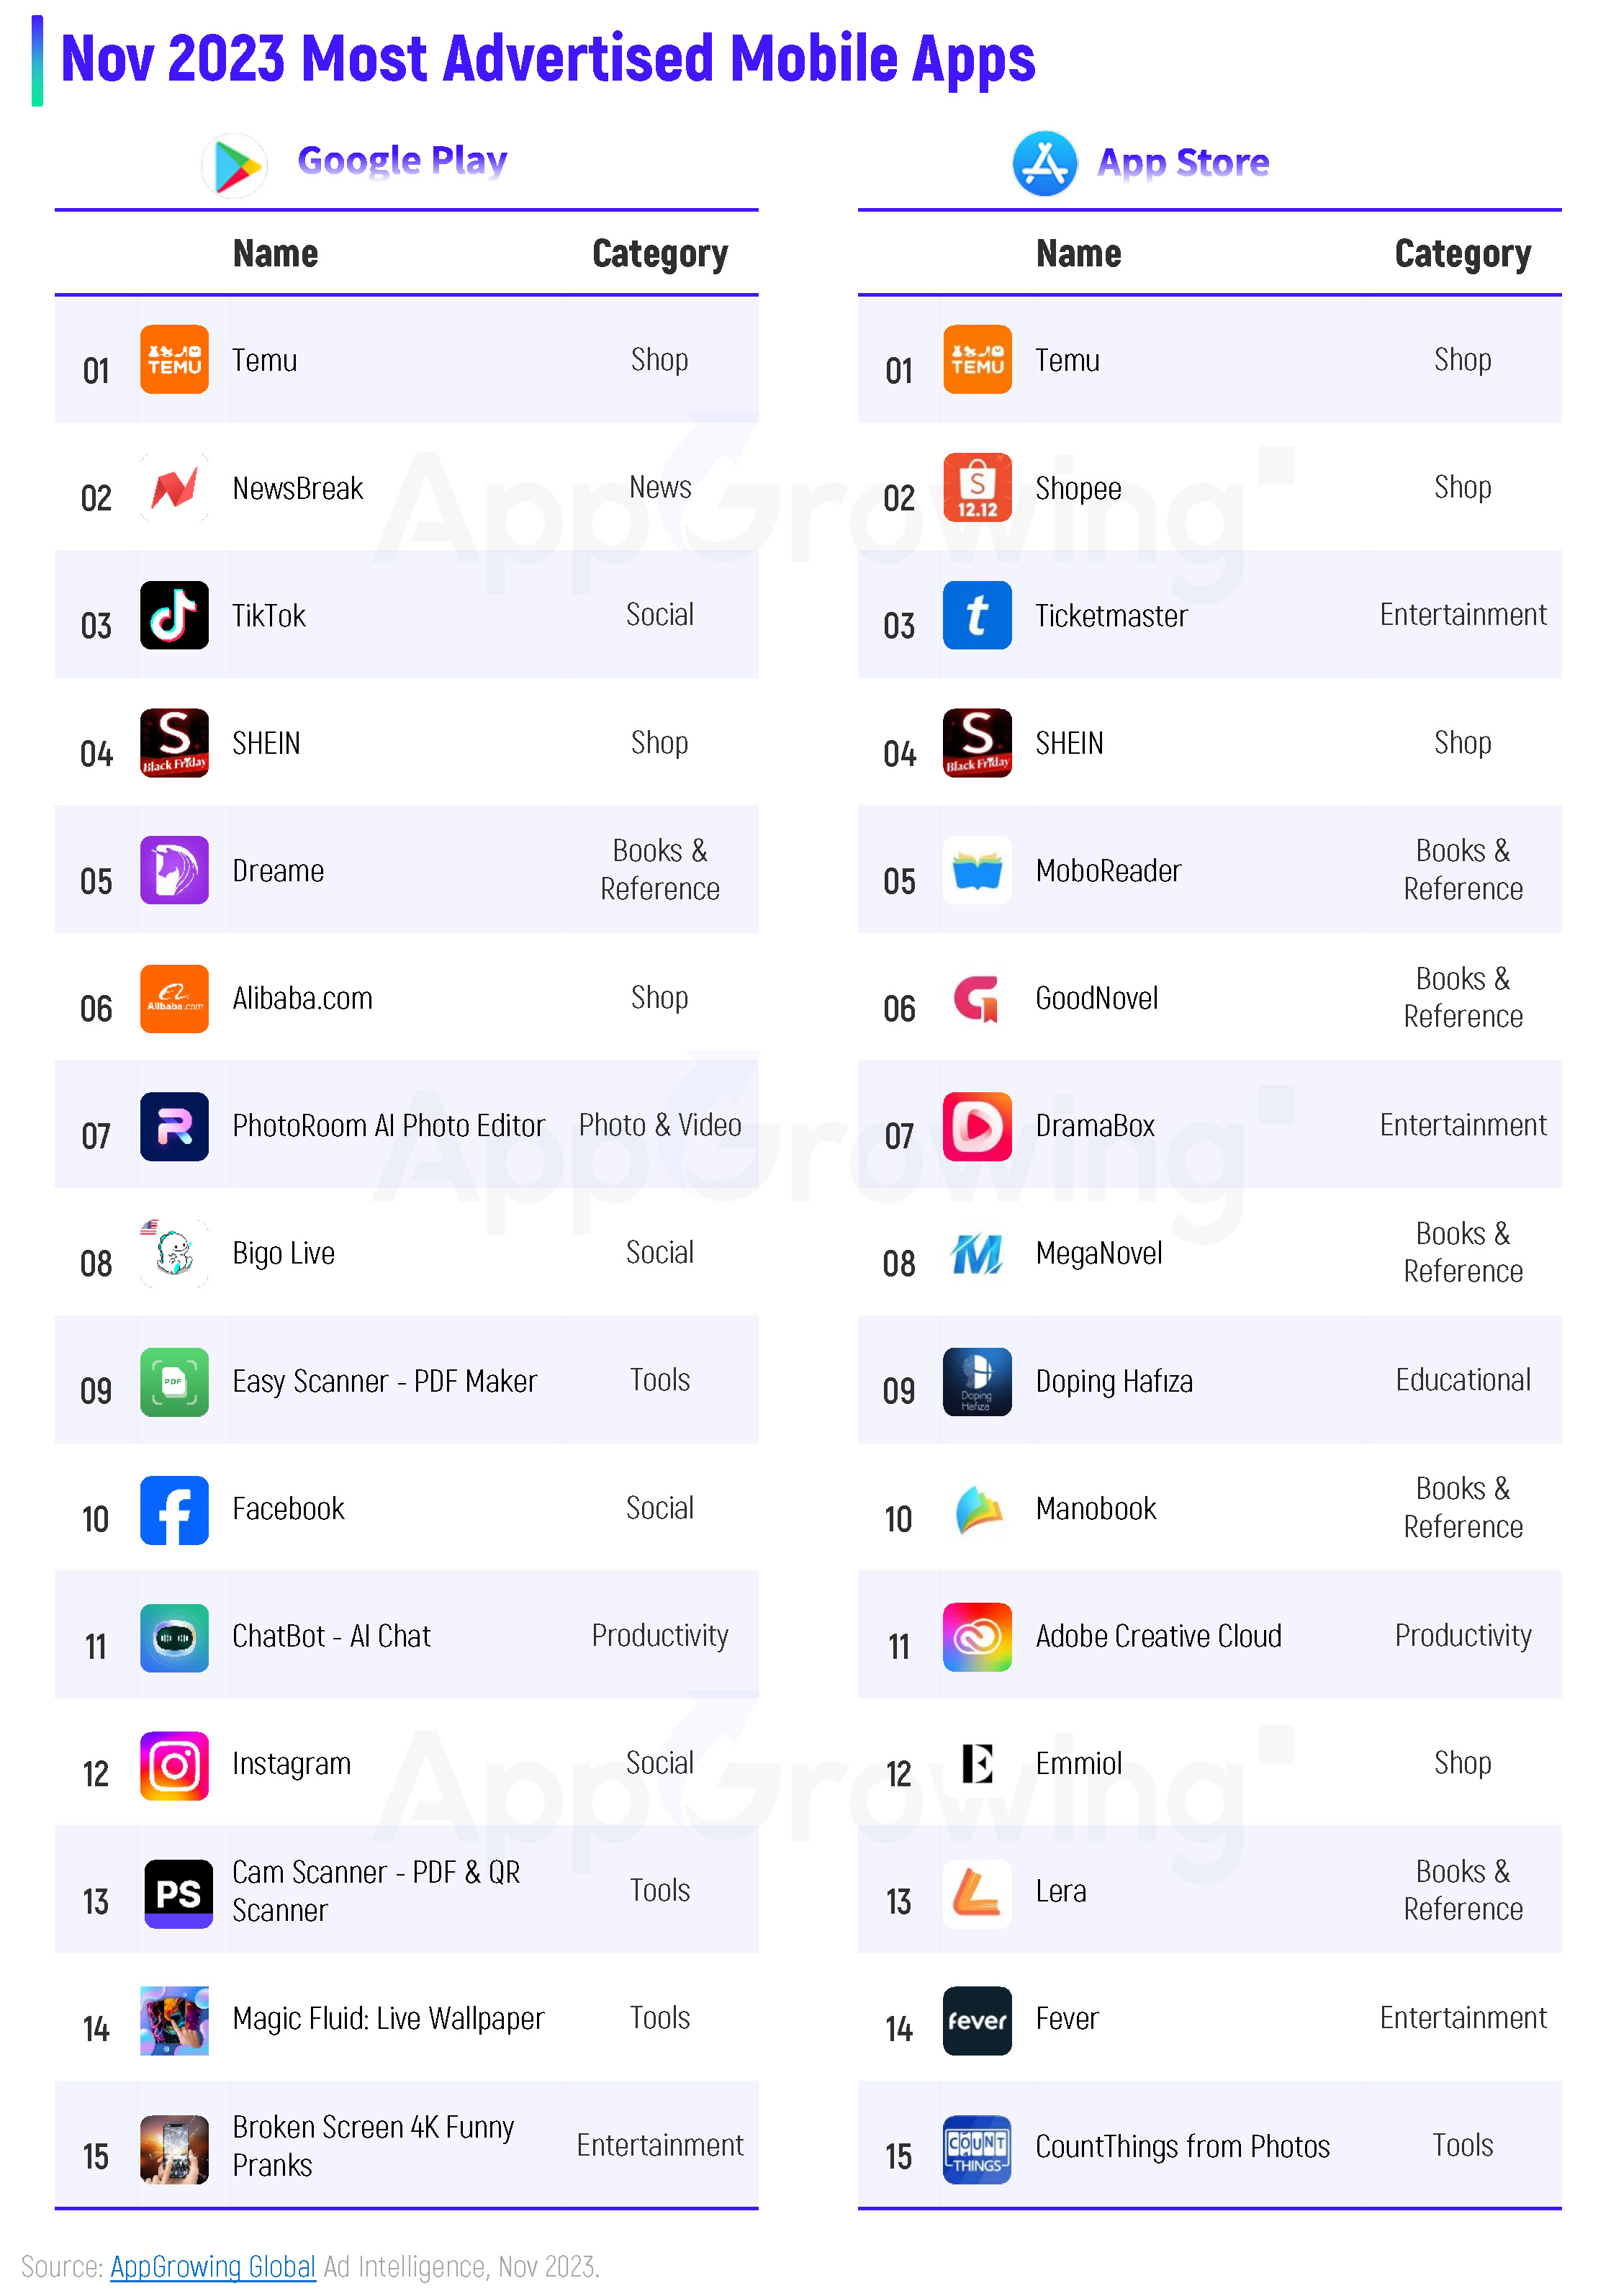
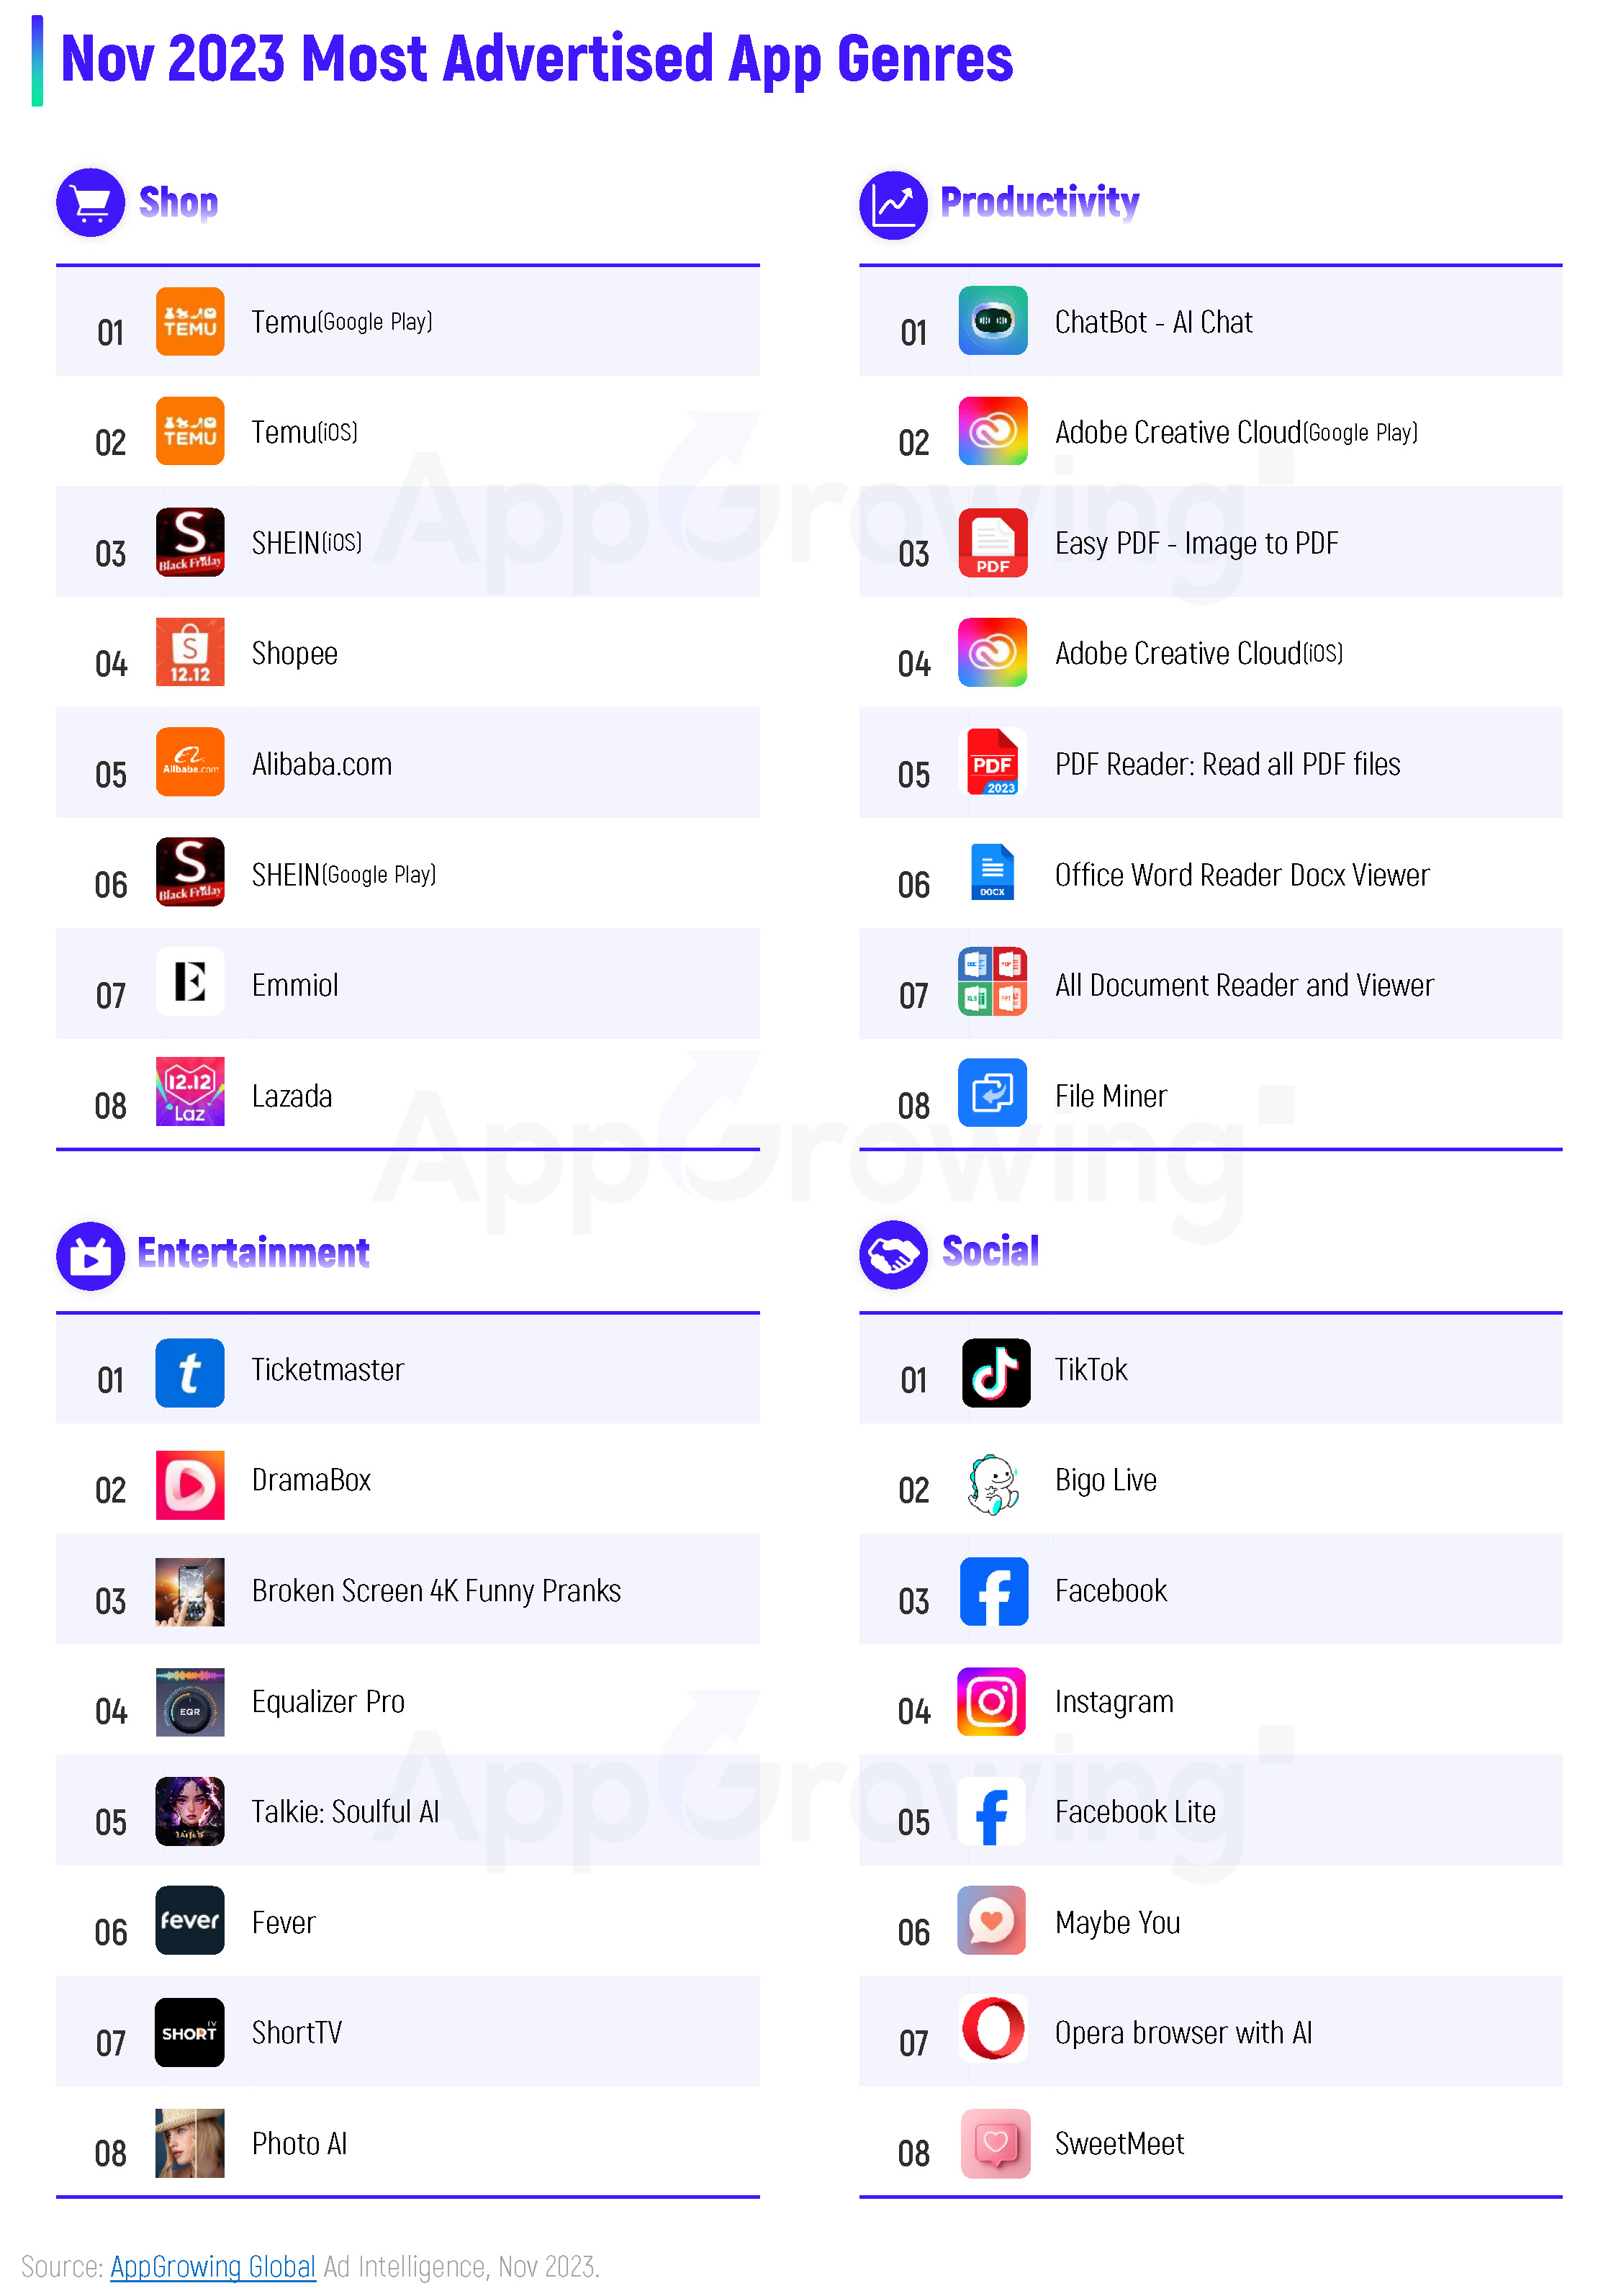
The Most Advertised Apps on Google Play in November continued to be Social Apps with 4 on the list. The head shop apps advertised heavily, with TEMU holding steady at #1 in ads, SHEIN at #4, and Alibaba.com at #6. In addition, a wallpaper tool App Magic Fluid: Live Wallpaper has seen a surge in ads, making it a "new face" on the list.
On App Store, TEMU took the No. 1 spot with powerful ads, Shopee came in 2nd, SHEIN in 4th, and Emmiol, another Shop app, came in 12th. The most charted category continues to be Books & Reference, with five titles. In addition, Fever, a ticketing app, and CountThings from Photos, a counting tool, are new to the list.
For this month's Most Advertised App category, AppGrowing picked Shop, Productivity, Entertainment, and Social.
As we can see from the Top 8 Shop App list, Pinduoduo and SHEIN are the most competitive media buyers, and both of them have reached the Top 8 in both app stores, with Pinduoduo's TEMU taking the No. 1 and No. 2 spots. In the Productivity category, the top 1 is an AIGC app, ChatBot, and Adobe's Adobe Creative Cloud is in the Top 5 in terms of ad volume in both app stores.
In the Entertainment category, 2 short drama apps made it to the Top 8, namely DramaBox at #2 and ShortTV at #7, both from Chinese developers. In addition to the familiar leaders in the social category, two dating apps entered the Top 8. Opera's browser app, Opera browser, which aggregates AIGC-related features, is also new to the list.
03 Case Analysis
Case 1: CountThings from Photos
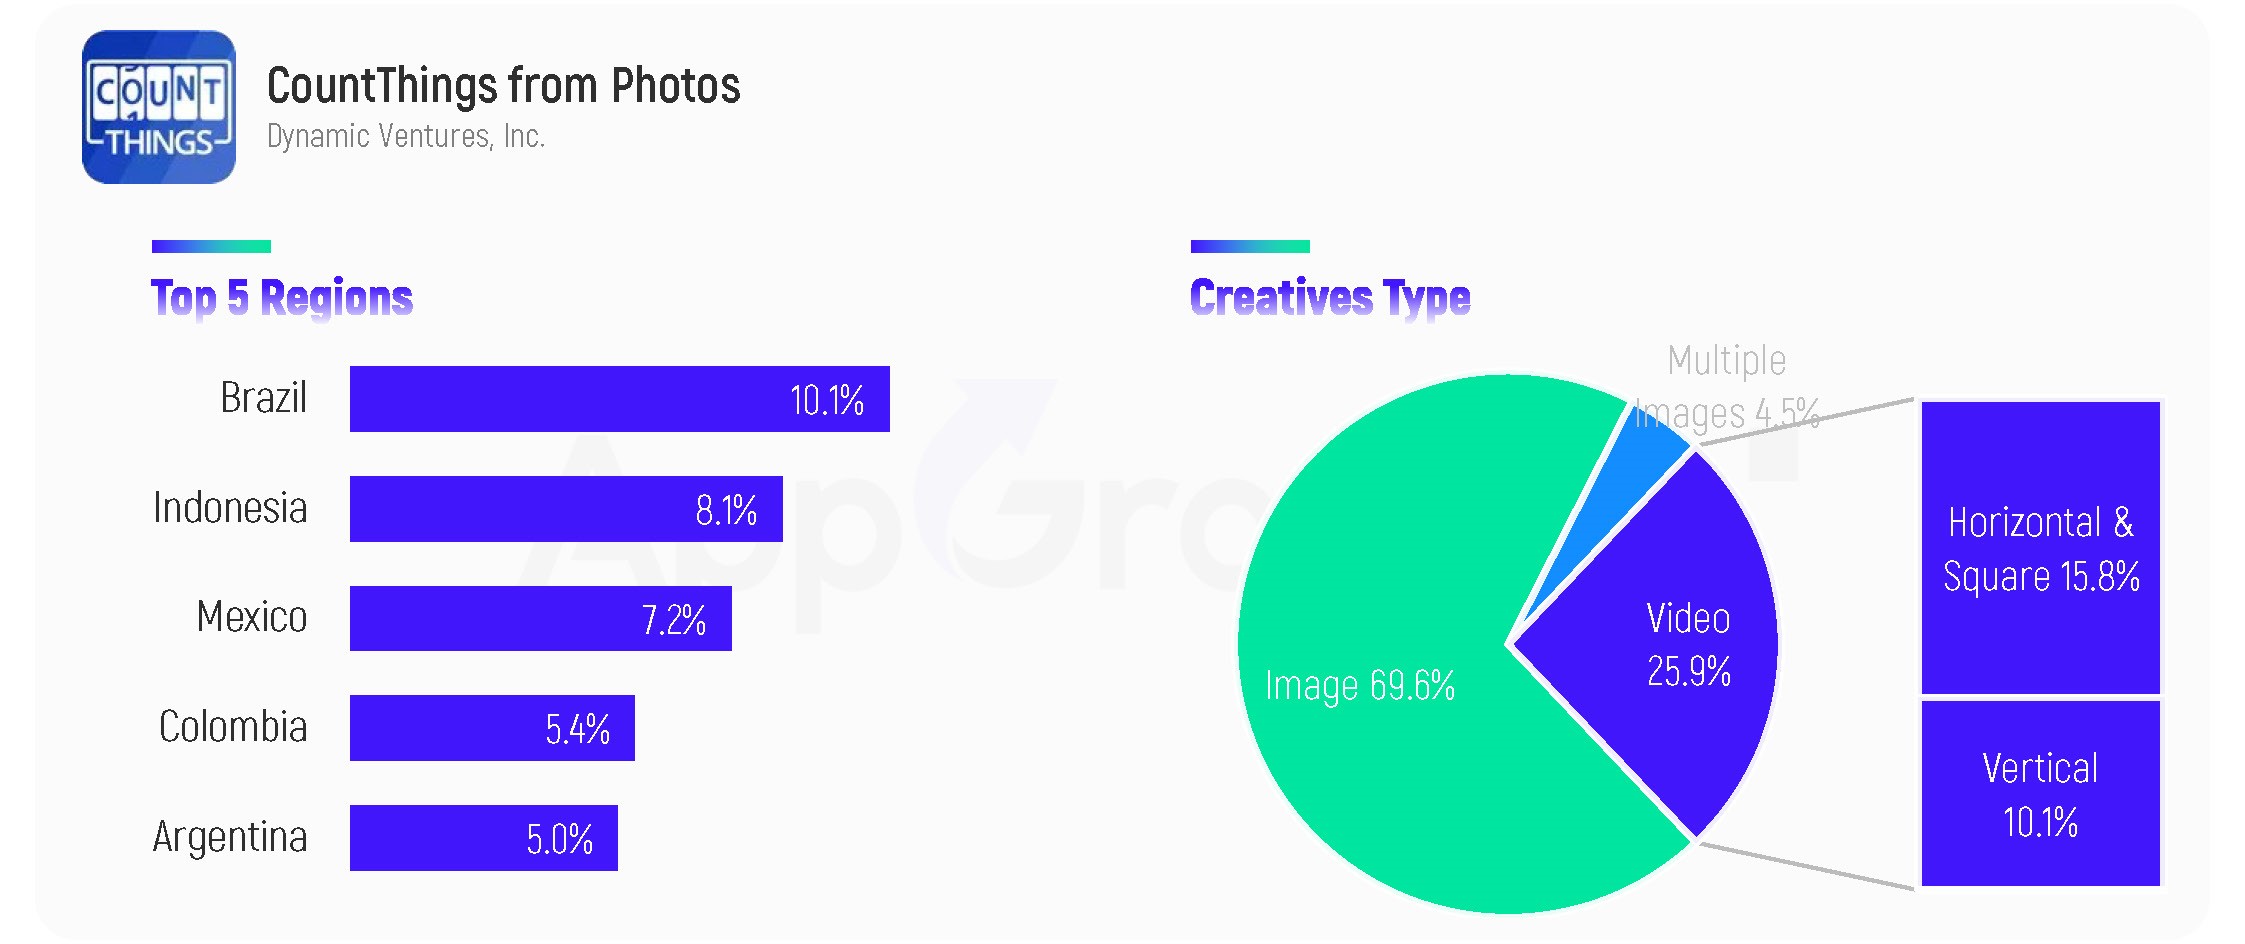
CountThings from Photos is an app that focuses on counting from photos. Its built-in store of templates covers scenarios such as factories, livestock, medicine, and the corresponding common items. According to AppGrowing, the App launched back in 2017, but kicked off a massive ad campaign in recent two months and made it to the Top 15 of the App Store app ad charts in November.
The Top 5 regions for CountThings from Photos in November were Brazil, Indonesia, Mexico, Colombia and Argentina, with a focus on emerging markets. Creatives were dominated by images, accounting for nearly 70% of the total.
As a tool app, the creative of CountThings from Photos is centered around the main feature to quickly and accurately convey to the user how powerful it is. For example, the video showing the use of the app in a real-life scenario from first view. The app scans pictures of various large quantities of items and tells the exact quantities quickly and accurately. App name and website shown at the end drive viewers to download.
The use of simple MG animations to explain features is a common creative production choice for utility apps. CountThings from Photos is no exception. The following video also centers on the App's features and advantages. The simple animation in the first half of the video presents the scene of a worker counting the number of materials in a time-consuming and laborious manner. The text in the upper left corner introduces the features and benefits, triggering viewers‘ curiosity.
Case 2: Alibaba.com
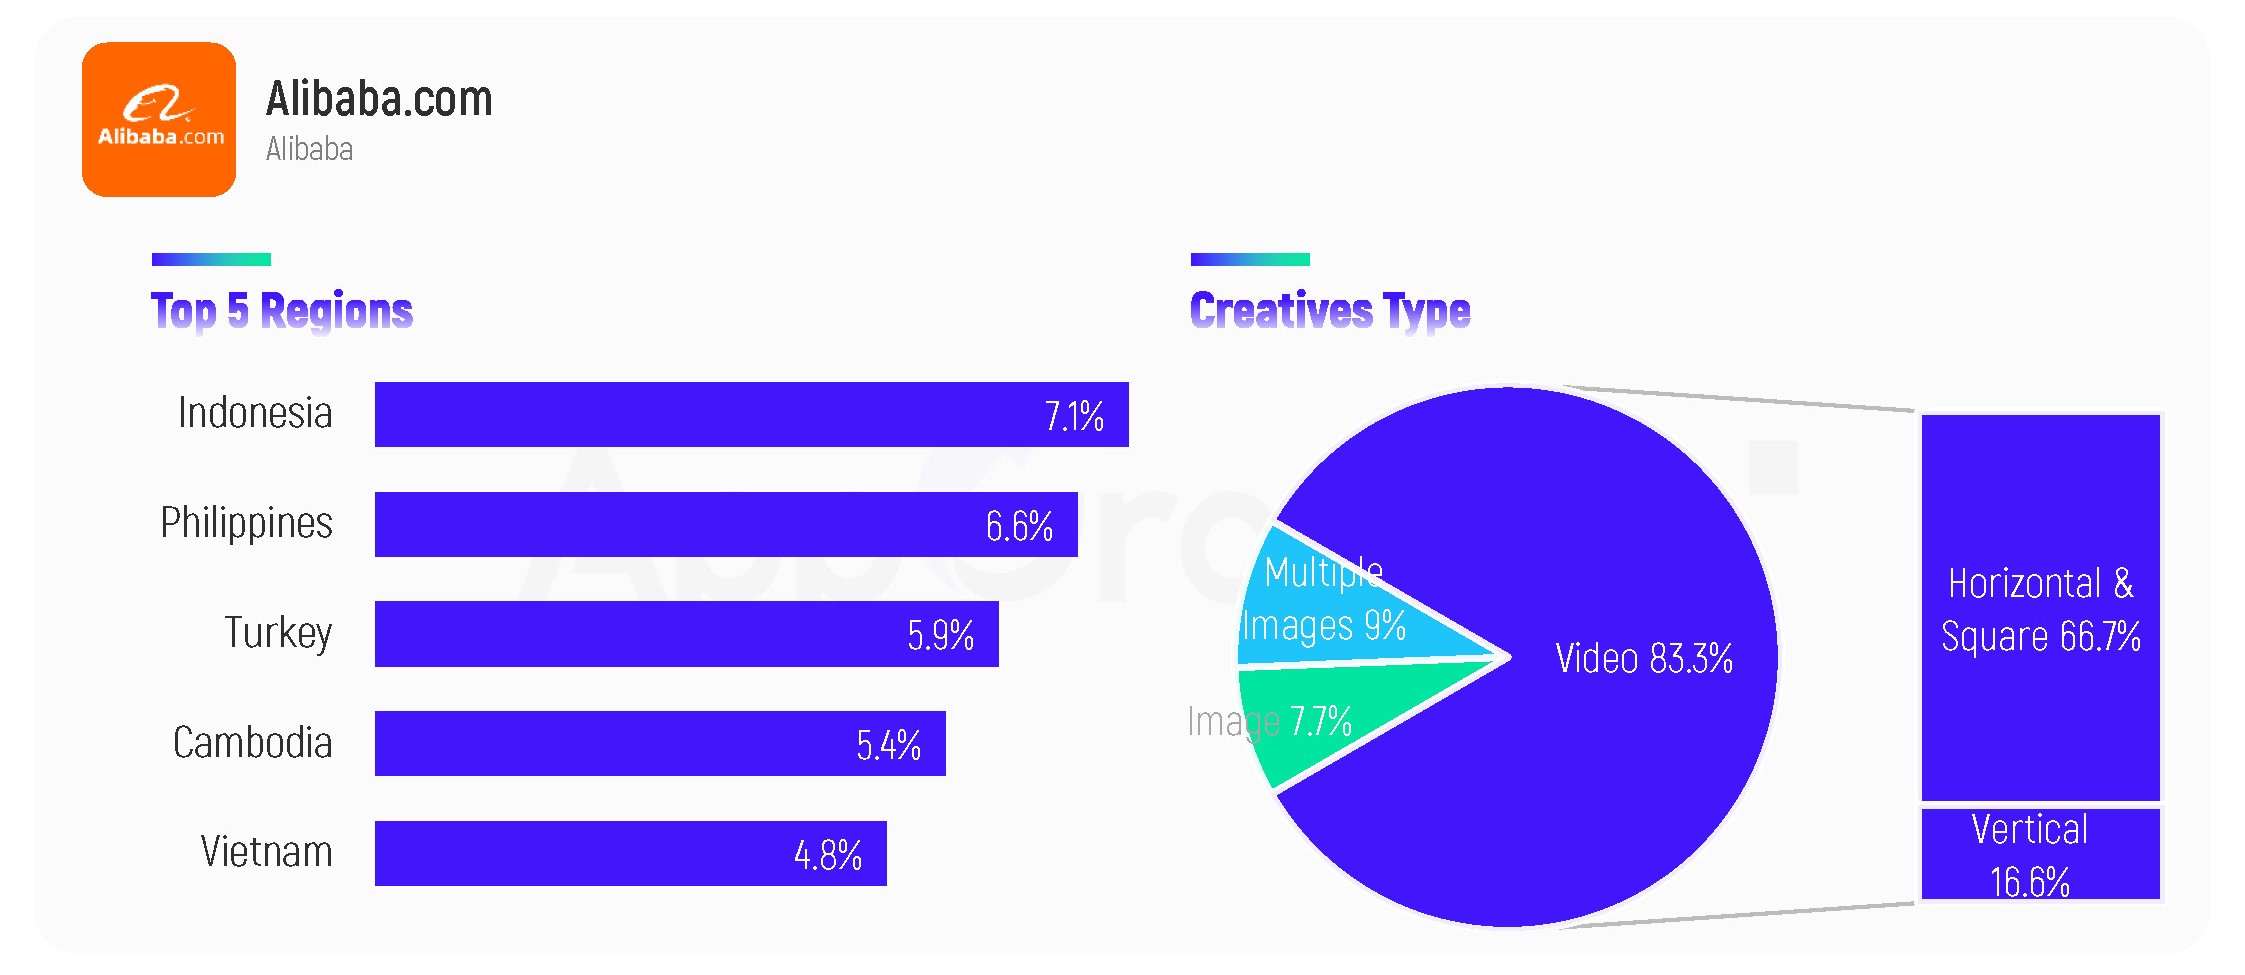
Alibaba.com, Alibaba's B2B e-commerce platform, continued to grow in ad volume recently, ranking No. 6 on Google Play's ad charts for November, according to AppGrowing. the app's main ad market in November was Southeast Asia, with the Top 5 regions being Indonesia, the Philippines, Turkey, Cambodia, and Vietnam. Creatives were dominated by video, accounting for more than 80% of the total.
In terms of creative, the App audience is mainly merchants, so the content perspective is mostly from the seller's point of view, highlighting the professional and efficient e-commerce and logistics services of the Alibaba.com platform, and the use of live-action elements is frequent.
The video starts with a shocked expression of the actor to grab viewers' attention. The text throws up questions and then moves on to the introduction of the app's features and benefits.
The beginning of the video shows a real man using his phone to negotiate business. The live action scene increases the sense of immersion and introduces the App in the conversation, followed by the product interface of the App and the text briefly presenting the App's selling points.
