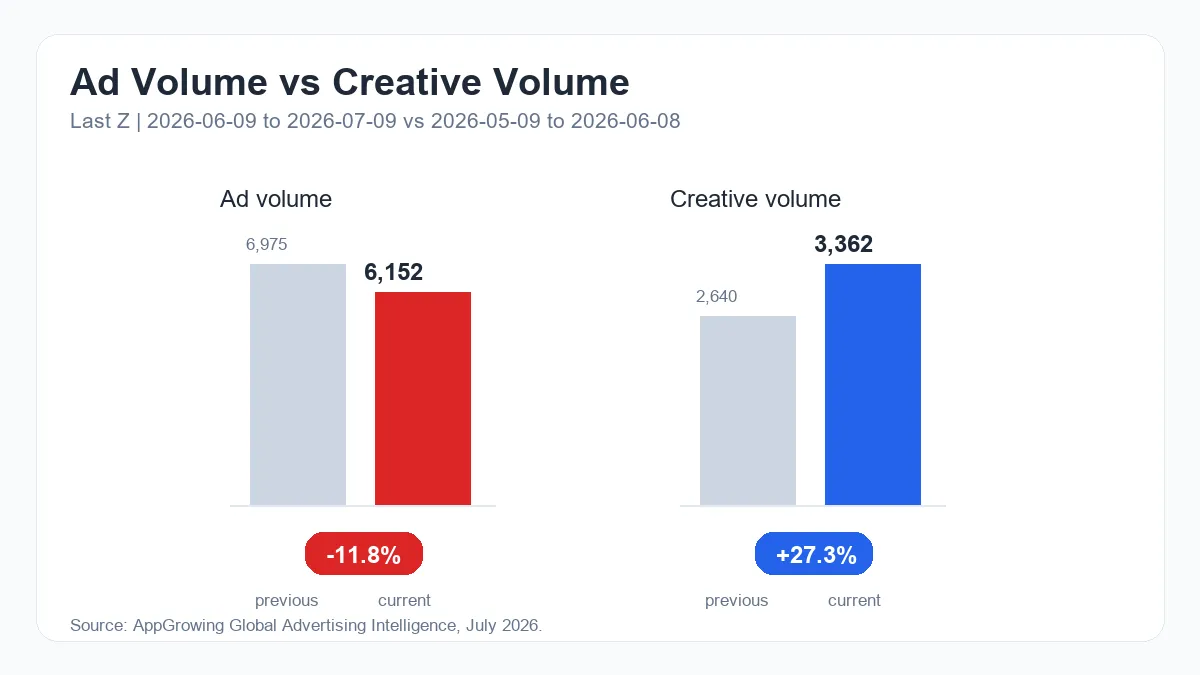
Last Z looks more like testing than simple cooling because creative volume rose strongly while ad volume declined. Why Last Z Creative Testing Expanded While Ad Volume Declined should be read as testing expansion without matching delivery expansion. Verified AppGrowing data shows Last Z ad volume fell from 6,975 to 6,152, or -11.8%, while creative volume rose from 2,640 to 3,362, or +27.3%.
| Metric | Previous Period | Current Period | Change |
|---|---|---|---|
| Ad volume | 6,975 | 6,152 | -11.8% |
| Creative volume | 2,640 | 3,362 | +27.3% |
Why does Last Z look like testing rather than cooling?
An 11.8% decline in ad volume shows lower visible delivery, but a 27.3% increase in creative volume shows that the asset pool expanded. That combination usually points to testing activity rather than a simple pullback.
The useful question is which new themes entered the mix, not whether ad volume alone declined.
How should the new assets be separated?
Start with survival pressure, base defense, zombie threat, character progression, and resource-choice concepts. Then decide whether each asset introduces a new theme or only replaces the scene around an old theme.
If several new assets cluster around the same concept, that concept may become a later delivery candidate.
When should Last Z monitoring priority rise?
If ad volume starts to recover in the next cycle, Last Z deserves higher-frequency competitor monitoring. If creative volume keeps rising while ad volume stays lower, keep it as a low-volume testing watch.
The current action is to record new concept families, not to claim delivery expansion.
