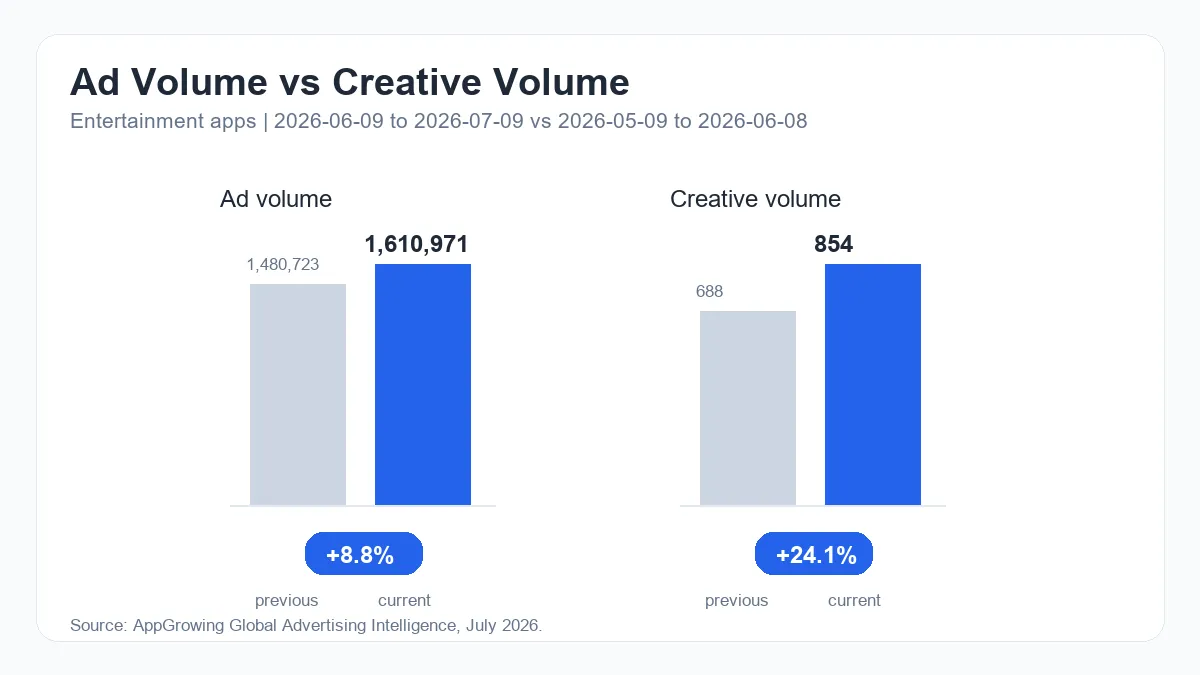
Entertainment apps show a different pattern from divergence cases because both delivery and creative output increased. What Rising Entertainment App Ads and Creatives Mean for Creative Monitoring should be treated as an expansion-style monitoring signal. Verified AppGrowing data shows ad volume rose from 1,480,723 to 1,610,971, or +8.8%, while creative volume rose from 688 to 854, or +24.1%.
| Metric | Previous Period | Current Period | Change |
|---|---|---|---|
| Ad volume | 1,480,723 | 1,610,971 | +8.8% |
| Creative volume | 688 | 854 | +24.1% |
Why is this an expansion-style monitoring signal?
Higher ad volume shows broader visible delivery, and a 24.1% increase in creative volume shows that the asset pool also expanded. When both metrics rise, the team should look beyond retained creatives and identify new concept families.
Entertainment hooks have short lifecycles and fast format rotation, so this signal belongs in weekly monitoring rather than a slow monthly review.
How should the monitoring cadence be built?
Start by tagging opening hooks: story conflict, identity reversal, free access, social stimulus, visual spectacle, or short-video pacing. Then separate assets that introduce a real new concept from assets that multiply versions of the same idea.
New concepts show where the category may be moving. Retained creatives show which messages remain stable.
When should this move into script production?
If new concept families keep appearing while ad volume also rises, creative teams can prepare script variants. If creative volume rises but concepts repeat, the team should improve taxonomy and review cadence first.
For Entertainment apps, the useful action is faster monitoring of hook freshness, not a claim about campaign performance.
